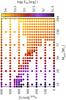
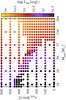
Fig. 16
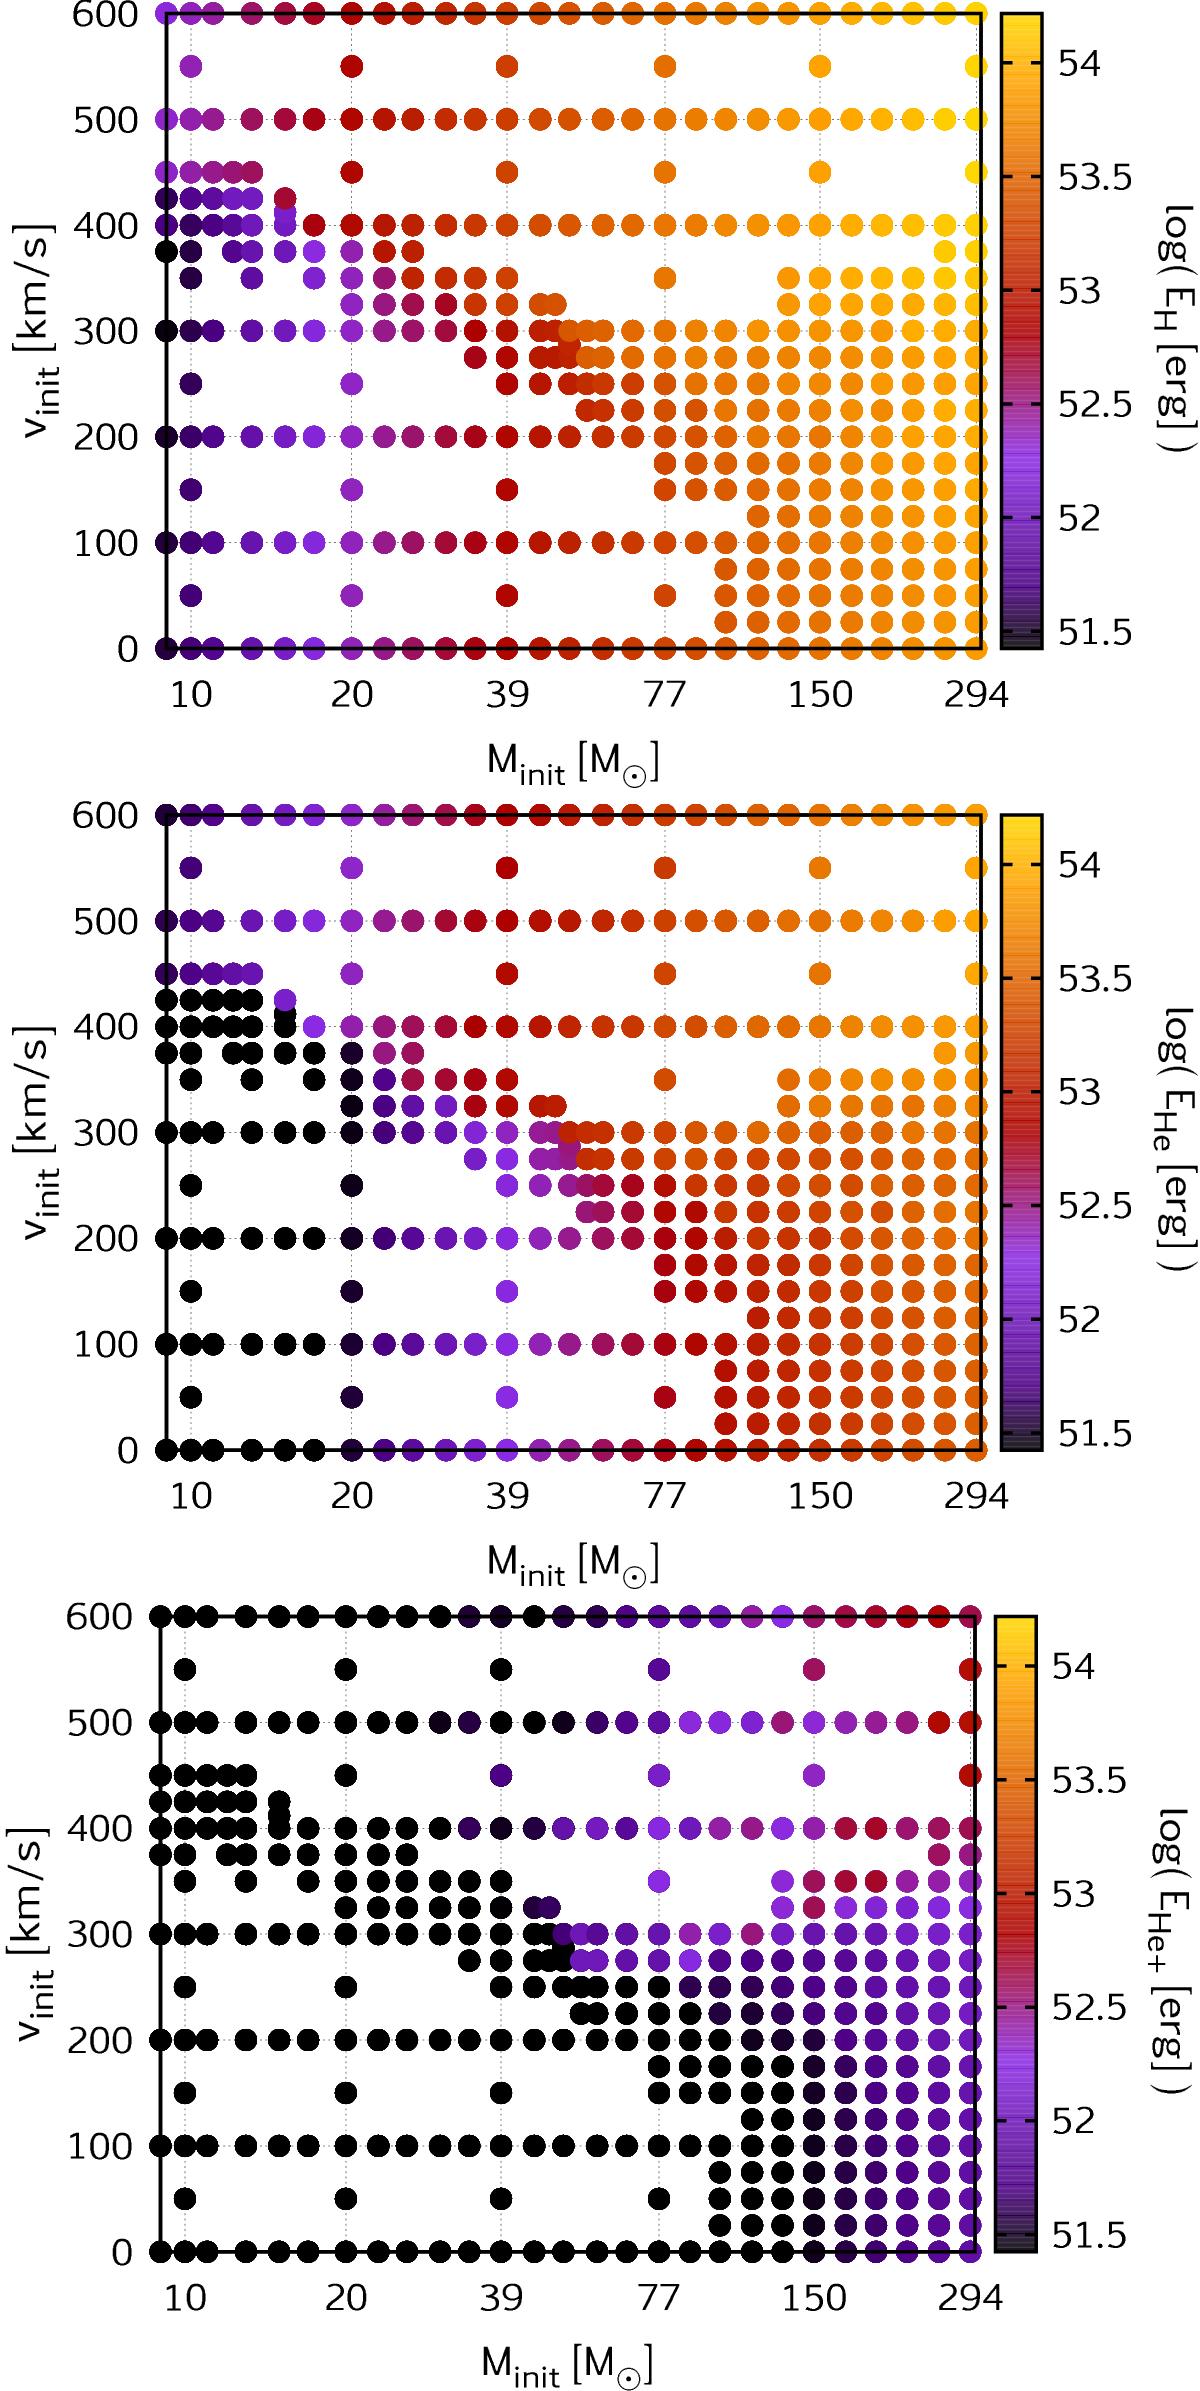
Top: ionising energy emitted by our stellar sequences in the Lyman continuum during their main-sequence lifetime. Each evolutionary sequence of our grid is represented by one dot in this diagram and the total amount of energy emitted in the Lyman continuum (in erg) is colour coded in a logarithmic scale. Middle and bottom: the same as the top figure but for the HeI and He II continua, respectively.
Current usage metrics show cumulative count of Article Views (full-text article views including HTML views, PDF and ePub downloads, according to the available data) and Abstracts Views on Vision4Press platform.
Data correspond to usage on the plateform after 2015. The current usage metrics is available 48-96 hours after online publication and is updated daily on week days.
Initial download of the metrics may take a while.