Fig. 14
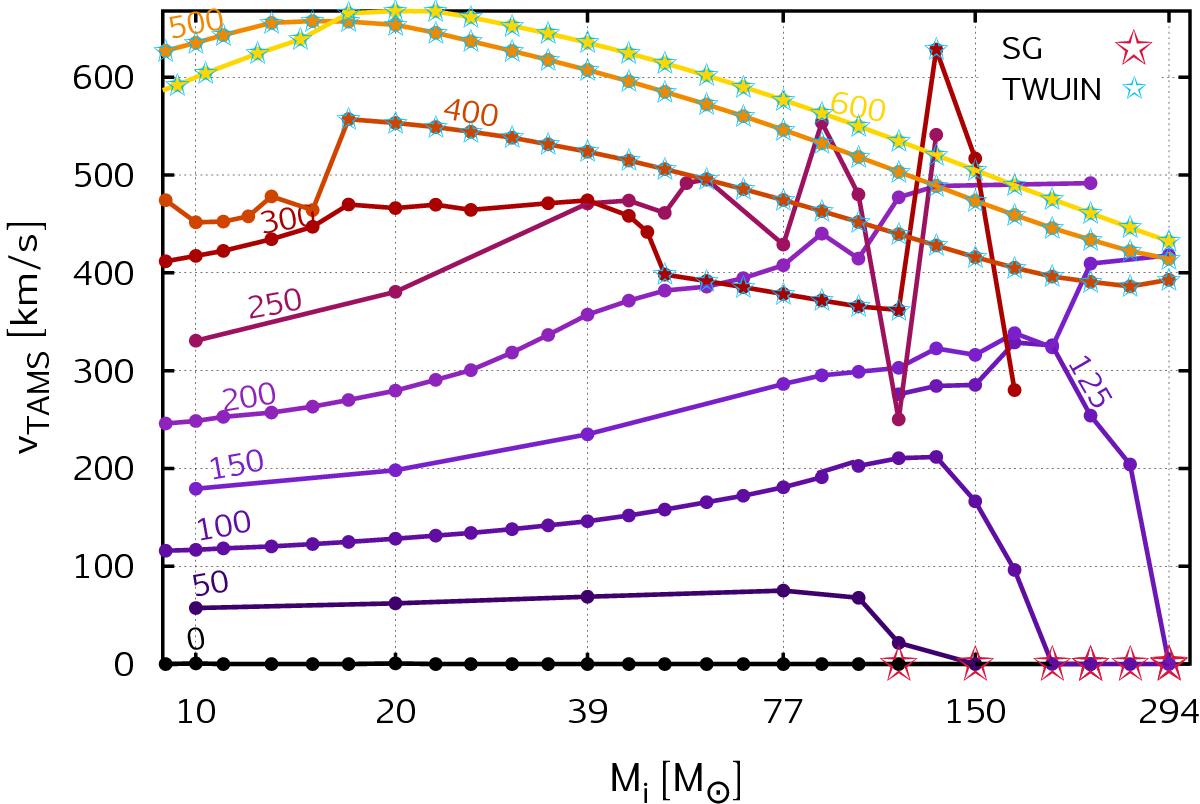
Rotational velocity at the terminal age main-sequence (TAMS) as a function of initial mass. Every dot represents one evolutionary sequence. The colours refer to the initial rotational velocity; dots of model sequences with the same initial rotational velocity are connected and labelled (units in km s-1). Only those sequences that have reached YC = 0.98 have been plotted. (See also Fig. 4 which shows the rotational velocity at the ZAMS: here the same models are connected as in Fig. 4.) Core-hydrogen-burning cool supergiants (SG) are marked with large red stars, chemically-homogeneous TWUIN stars (Y![]() ) are marked with small blue stars.
) are marked with small blue stars.
Current usage metrics show cumulative count of Article Views (full-text article views including HTML views, PDF and ePub downloads, according to the available data) and Abstracts Views on Vision4Press platform.
Data correspond to usage on the plateform after 2015. The current usage metrics is available 48-96 hours after online publication and is updated daily on week days.
Initial download of the metrics may take a while.