Fig. 8
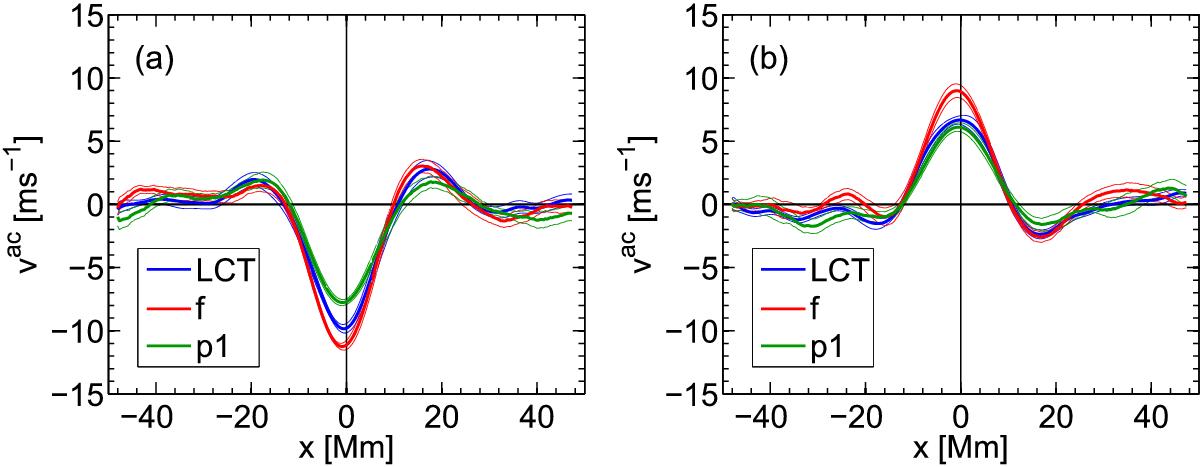
a) Cuts through the maps of the circulation velocity vac for the average supergranule outflow region at 40° latitude (shown in Fig. 6), at y = 0. The TD and LCT maps were derived from HMI Dopplergrams and intensity images. The thin lines denote estimates of the variability of the data as obtained from dividing the 336 datasets into eight parts. The 1σ level is shown. b) As a), but for the average supergranule inflow region at 40° latitude.
Current usage metrics show cumulative count of Article Views (full-text article views including HTML views, PDF and ePub downloads, according to the available data) and Abstracts Views on Vision4Press platform.
Data correspond to usage on the plateform after 2015. The current usage metrics is available 48-96 hours after online publication and is updated daily on week days.
Initial download of the metrics may take a while.