Fig. 6
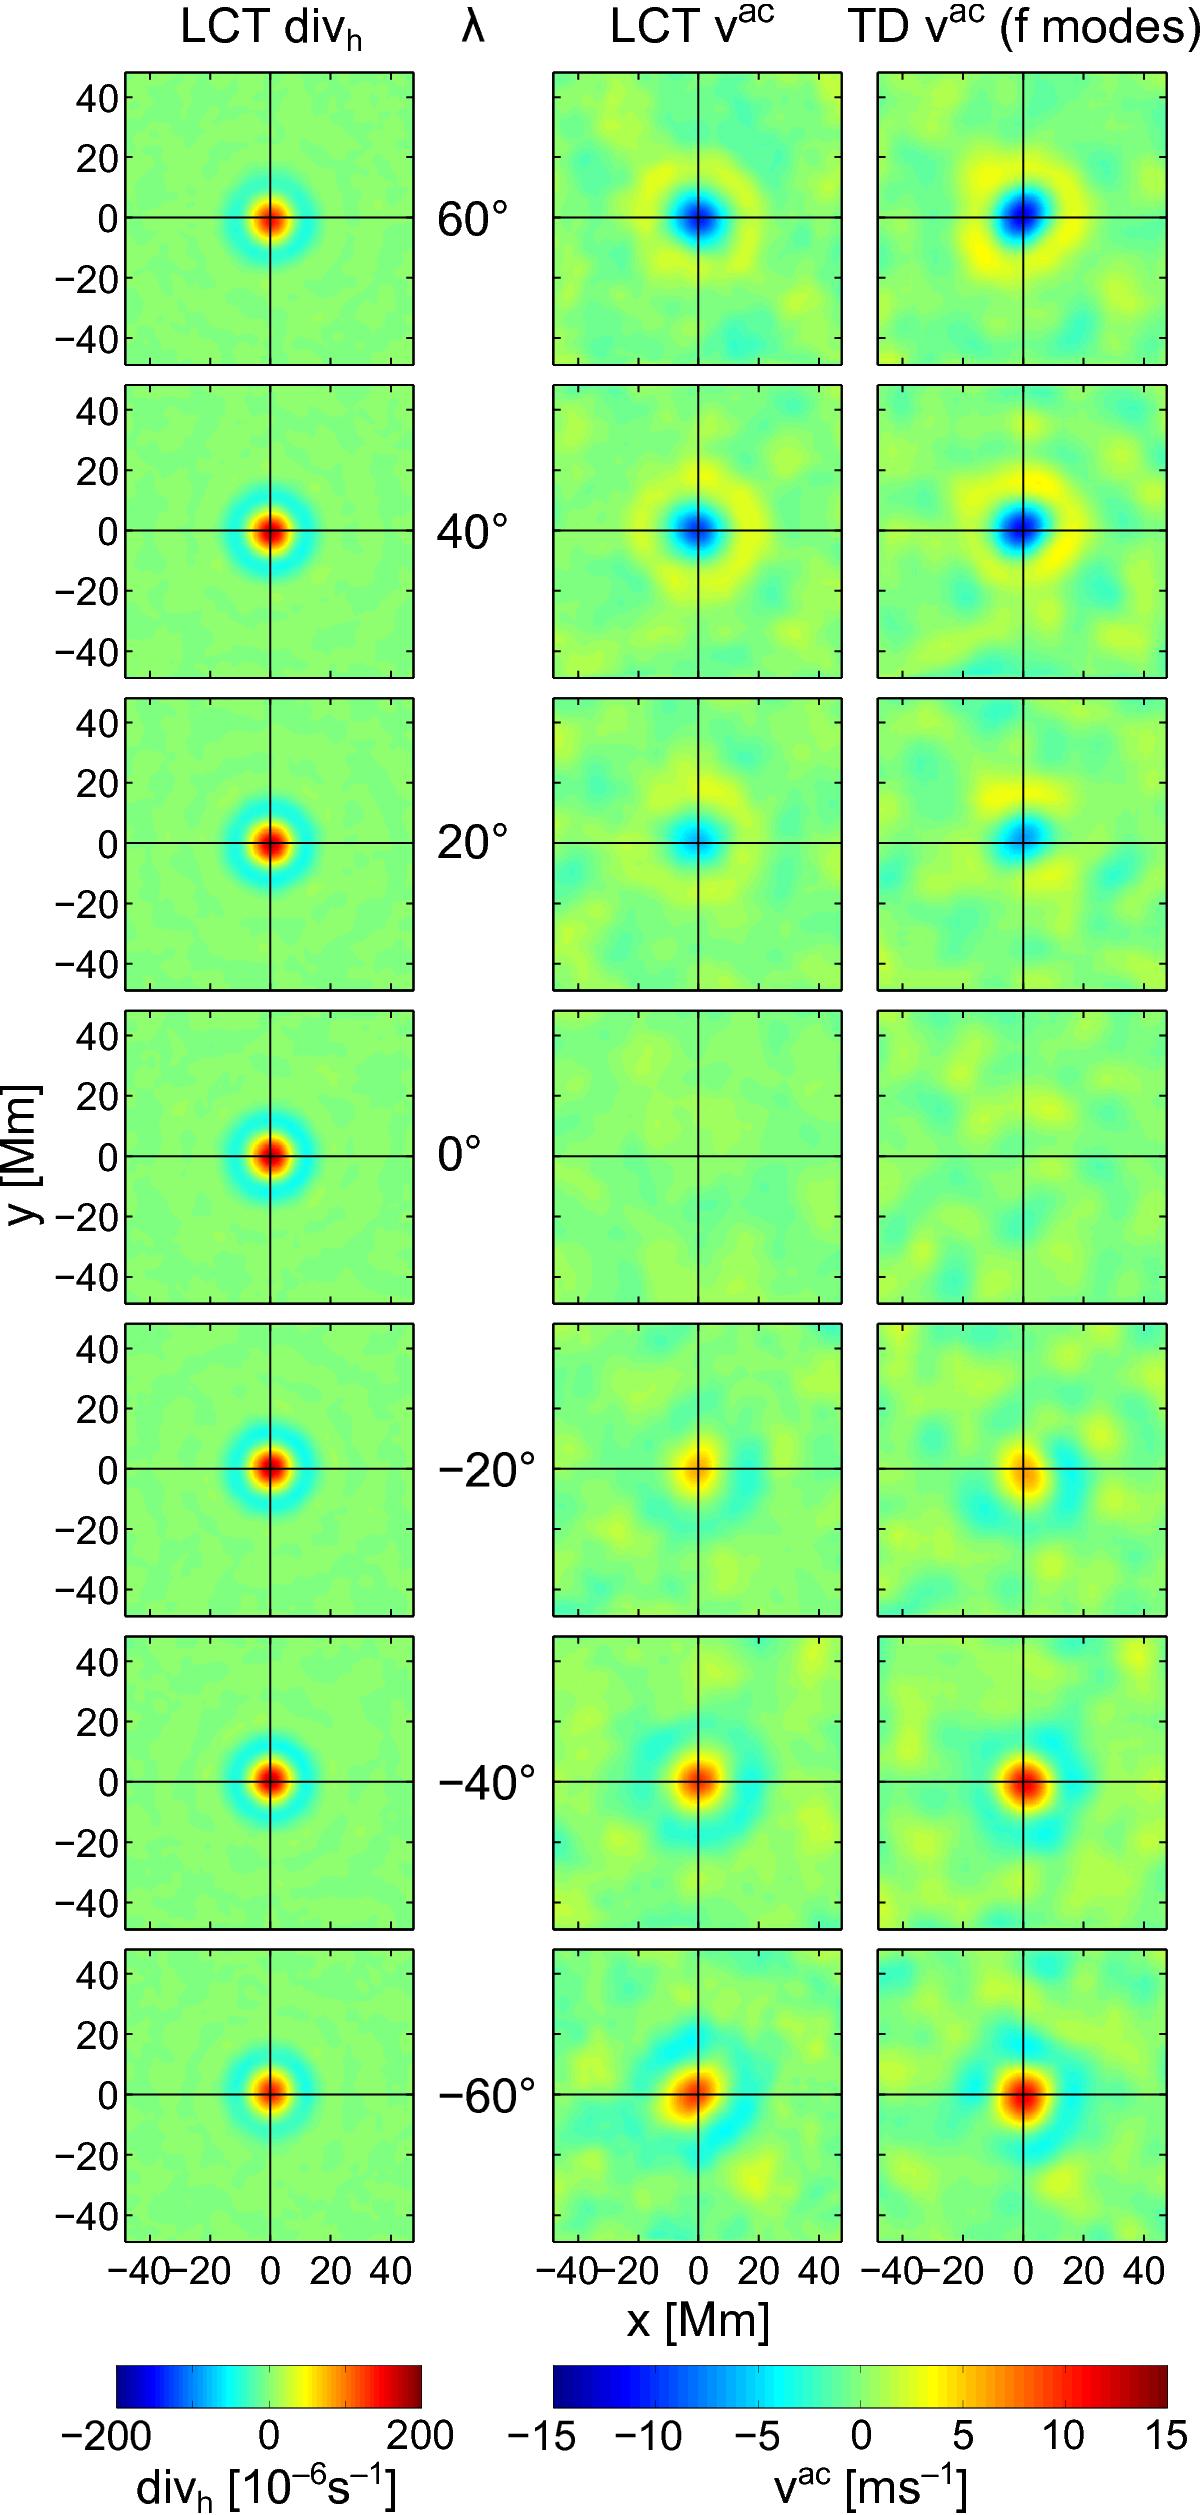
Maps of horizontal divergence divh and circulation velocity vac for the average supergranule outflow regions at various solar latitudes (after correction for geometrical center-to-limb systematics). The maps were derived from HMI intensity images and Dopplergrams. The horizontal divergence divh was computed from LCT vx and vy horizontal velocity maps. The LCT vac maps were obtained by averaging the tangential velocity component vt over an annulus with radius 10 Mm and half-width 2 Mm to resemble the τac measurement geometry (Fig. 1d). For TD, the vac maps are based on τac travel-time maps (Fig. 1b) that were computed from Dopplergrams.
Current usage metrics show cumulative count of Article Views (full-text article views including HTML views, PDF and ePub downloads, according to the available data) and Abstracts Views on Vision4Press platform.
Data correspond to usage on the plateform after 2015. The current usage metrics is available 48-96 hours after online publication and is updated daily on week days.
Initial download of the metrics may take a while.