Fig. 5

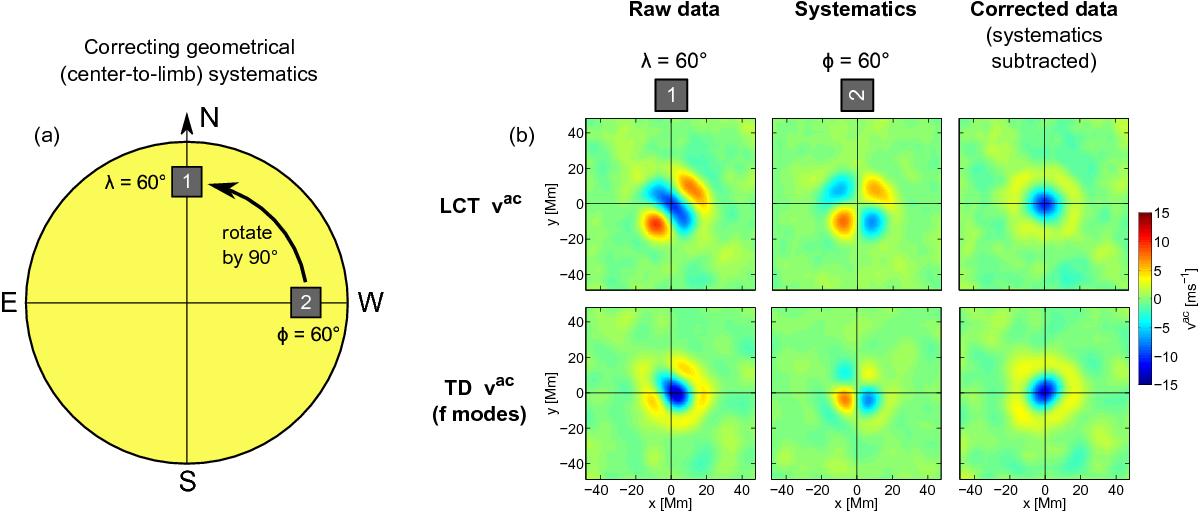
Correction for geometrical center-to-limb systematics in maps of circulation velocity vac for LCT and TD using HMI observations. This example shows the correction of vac maps at 60° latitude. a) Patch 1 (raw data) is located at 60° latitude at the central meridian. Patch 2 (systematics data) is situated at the equator, 60° west of the central meridian. We corrected the raw data by subtracting patch 2 from patch 1 (after rotating patch 2 anticlockwise by 90°). We note that we also use measurements of the systematics from the east for the correction (rotated clockwise by 90°). This is omitted in the sketch for clarity. b) Maps of vac for LCT and f-mode TD. The three columns of panels show (from left to right) the measured raw data at 60° latitude, the measured systematics from 60° west and east (rotated and averaged), and the corrected data.
Current usage metrics show cumulative count of Article Views (full-text article views including HTML views, PDF and ePub downloads, according to the available data) and Abstracts Views on Vision4Press platform.
Data correspond to usage on the plateform after 2015. The current usage metrics is available 48-96 hours after online publication and is updated daily on week days.
Initial download of the metrics may take a while.


