Fig. 4
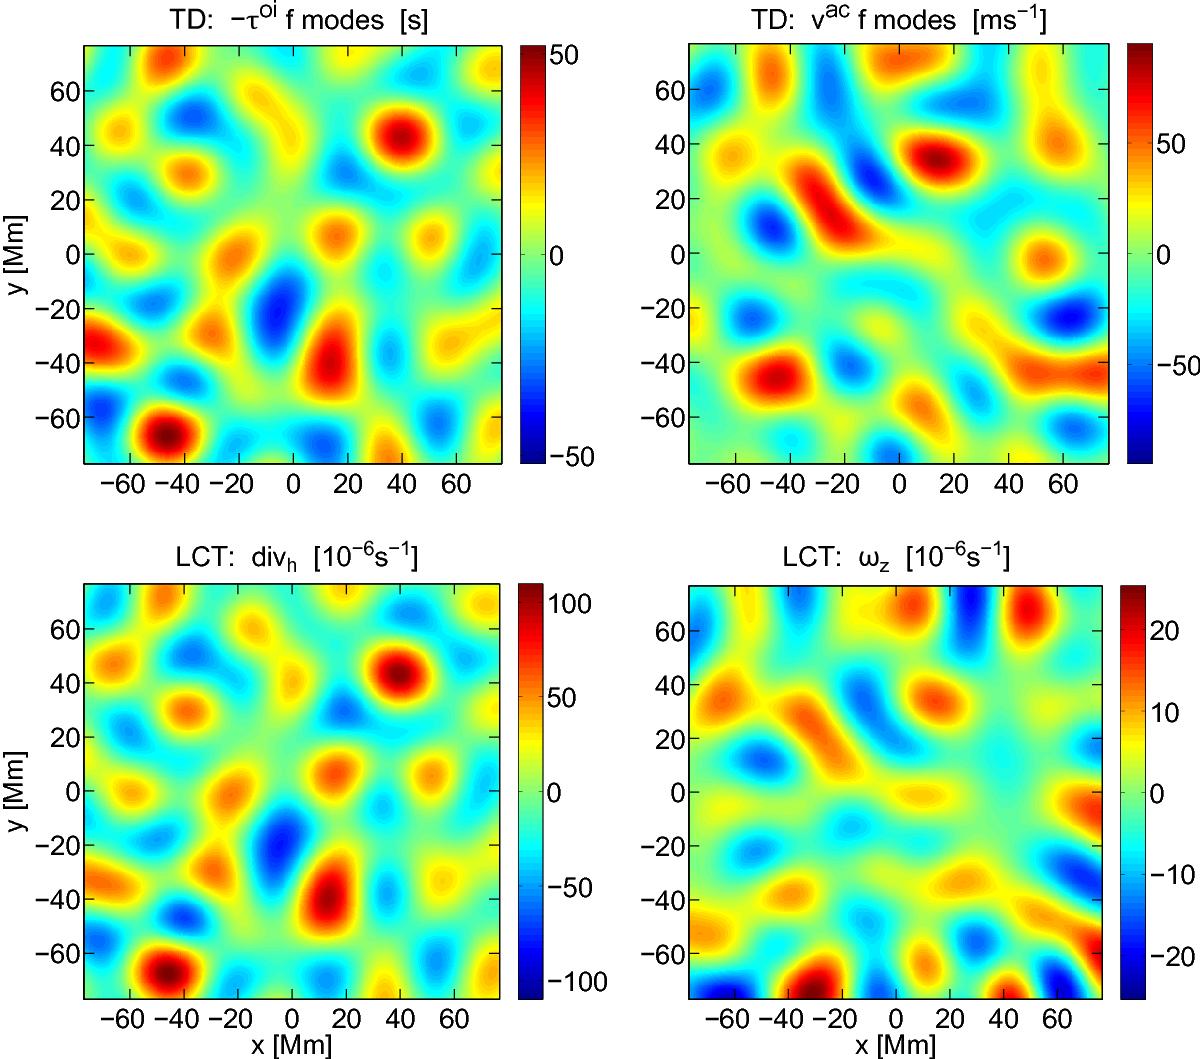
Comparison of TD and LCT maps at the equator. All maps are based on 8 h of HMI images (intensity and Doppler velocity) taken on 1 May 2010 and have been band-pass filtered around kR⊙ = 100. The color bar limits are set to the maximum absolute value of the corresponding map and symmetrized around zero. Left column: divergence-sensitive travel times τoi for f modes as well as LCT horizontal divergence divh. Right column: circulation velocities vac for TD as well as LCT vertical vorticity ωz. The TD τac maps were converted into velocity maps by pointwise multiplication with a constant factor −5.62 m s-2 (f modes) and −11.1 m s-2 (p1 modes), see Appendix B for details.
Current usage metrics show cumulative count of Article Views (full-text article views including HTML views, PDF and ePub downloads, according to the available data) and Abstracts Views on Vision4Press platform.
Data correspond to usage on the plateform after 2015. The current usage metrics is available 48-96 hours after online publication and is updated daily on week days.
Initial download of the metrics may take a while.