Fig. 3
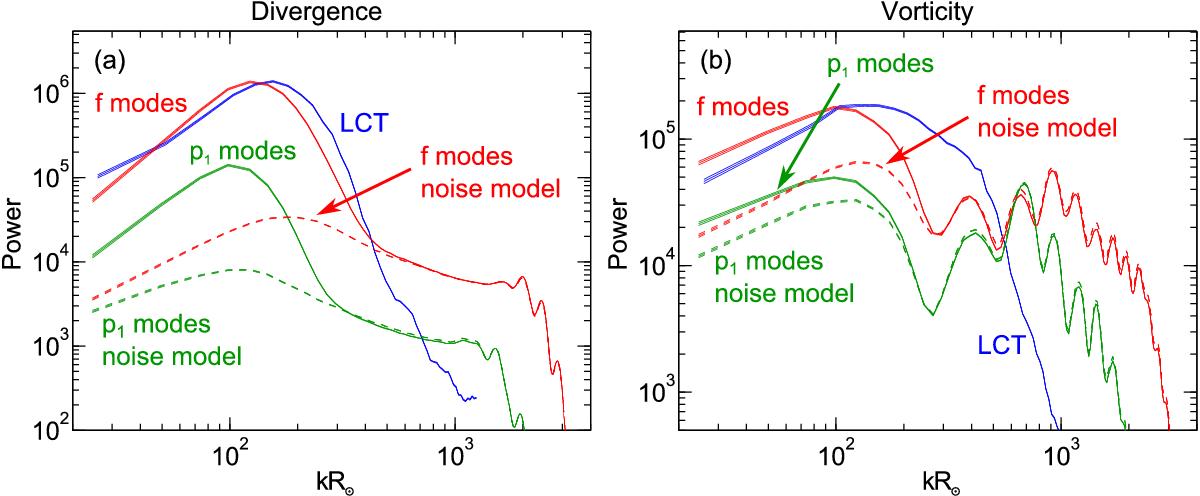
Power spectra (averaged over azimuth of wavevector k and 336 datasets) of TD travel-time maps, and LCT divh and ωz maps computed from HMI Dopplergrams and intensity images at the solar equator near disk center (distributed symmetrically between 7° east and west of the central meridian). a) Divergence-sensitive travel times τoi for f modes and p1 modes as well as LCT divh. b) Vorticity-sensitive travel times τac for f modes and p1 modes as well as LCT ωz. The amplitudes of LCT divh and ωz power were rescaled to match the range of the travel-time power. The dashed lines represent noise models for the f and p1 modes based on Gizon & Birch (2004). The thickness of the lines denotes the 1σ error.
Current usage metrics show cumulative count of Article Views (full-text article views including HTML views, PDF and ePub downloads, according to the available data) and Abstracts Views on Vision4Press platform.
Data correspond to usage on the plateform after 2015. The current usage metrics is available 48-96 hours after online publication and is updated daily on week days.
Initial download of the metrics may take a while.