Fig. 2
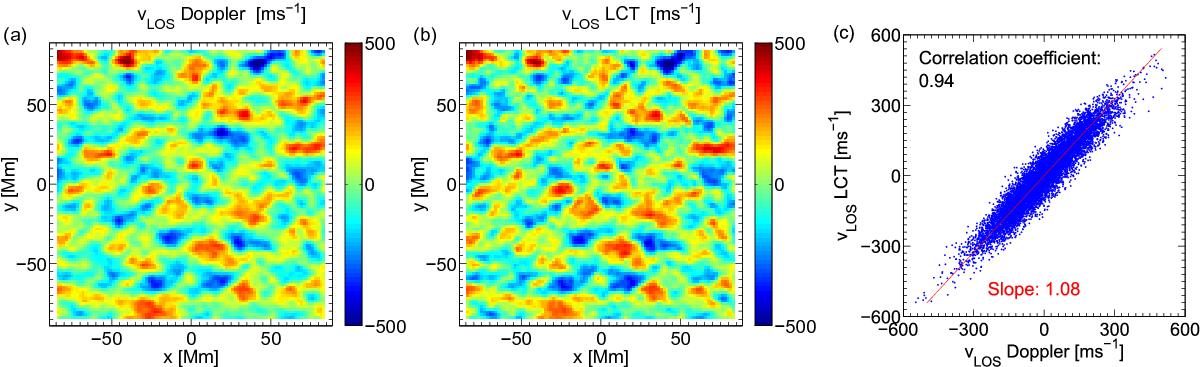
Comparison of line-of-sight velocity from two different data products at 40° solar latitude on 6 June 2010. a) HMI Dopplergram averaged over 8 h. The map was convolved with a Gaussian of ![]() Mm and subsampled to match the coarser LCT resolution. The mean over the map and a linear function in the x direction (parameters determined by a least-squares fit) were subtracted. b) LCT map from HMI intensity images, averaged over 8 h. The line-of-sight velocity component was computed from the vx and vy components. For vy, the mean over the map and a linear function in the y direction were subtracted. c) Scatter plot of the two maps. The Pearson correlation coefficient is 0.94. The red line shows the direction of largest scatter and crosses the origin. It is a best-fit line in the sense that it minimizes the sum of squared distances of the points perpendicular to the line (Pearson 1901). This is different from linear regression, where no error in the x coordinate is assumed and only the sum of squared distances in the y coordinate is minimized. The slope of the red line is 1.08; the error in the direction of lowest scatter is 33.9 m s-1.
Mm and subsampled to match the coarser LCT resolution. The mean over the map and a linear function in the x direction (parameters determined by a least-squares fit) were subtracted. b) LCT map from HMI intensity images, averaged over 8 h. The line-of-sight velocity component was computed from the vx and vy components. For vy, the mean over the map and a linear function in the y direction were subtracted. c) Scatter plot of the two maps. The Pearson correlation coefficient is 0.94. The red line shows the direction of largest scatter and crosses the origin. It is a best-fit line in the sense that it minimizes the sum of squared distances of the points perpendicular to the line (Pearson 1901). This is different from linear regression, where no error in the x coordinate is assumed and only the sum of squared distances in the y coordinate is minimized. The slope of the red line is 1.08; the error in the direction of lowest scatter is 33.9 m s-1.
Current usage metrics show cumulative count of Article Views (full-text article views including HTML views, PDF and ePub downloads, according to the available data) and Abstracts Views on Vision4Press platform.
Data correspond to usage on the plateform after 2015. The current usage metrics is available 48-96 hours after online publication and is updated daily on week days.
Initial download of the metrics may take a while.