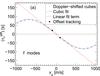
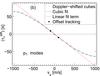
Fig. B.1

Point-to-point travel times from HMI Dopplergrams with artificial velocity signal. The point separation is 10 Mm in the east-west direction. a)f modes. b) p1 modes. The blue dots give the travel times from Dopplergram series that were constructed using the noise model by Gizon & Birch (2004). We applied a least-squares fit with a polynomial of degree three to the resulting data (black curves). The red curves show the linear term of the fit. For comparison, the black filled circles show travel times from HMI Dopplergrams that were tracked at an offset rate.
Current usage metrics show cumulative count of Article Views (full-text article views including HTML views, PDF and ePub downloads, according to the available data) and Abstracts Views on Vision4Press platform.
Data correspond to usage on the plateform after 2015. The current usage metrics is available 48-96 hours after online publication and is updated daily on week days.
Initial download of the metrics may take a while.