Free Access
Fig. 11
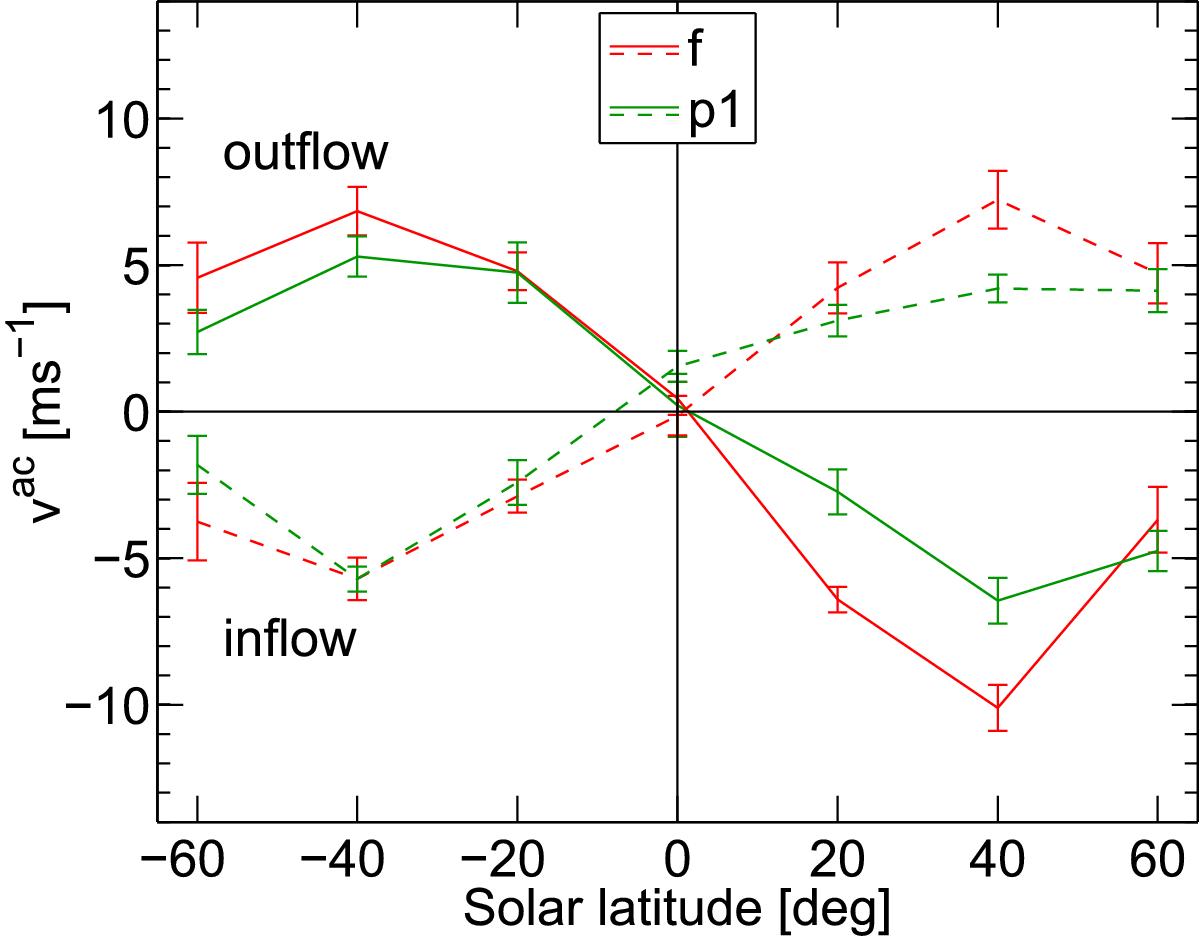
Velocities vac for the average supergranule measured at the origin at different solar latitudes from MDI TD (f modes and p1 modes). Solid lines are for the average supergranule outflow region, dashed lines for the average supergranule inflow region. The error bars were computed by dividing the 177 datasets into eight parts.
Current usage metrics show cumulative count of Article Views (full-text article views including HTML views, PDF and ePub downloads, according to the available data) and Abstracts Views on Vision4Press platform.
Data correspond to usage on the plateform after 2015. The current usage metrics is available 48-96 hours after online publication and is updated daily on week days.
Initial download of the metrics may take a while.