Fig. 10
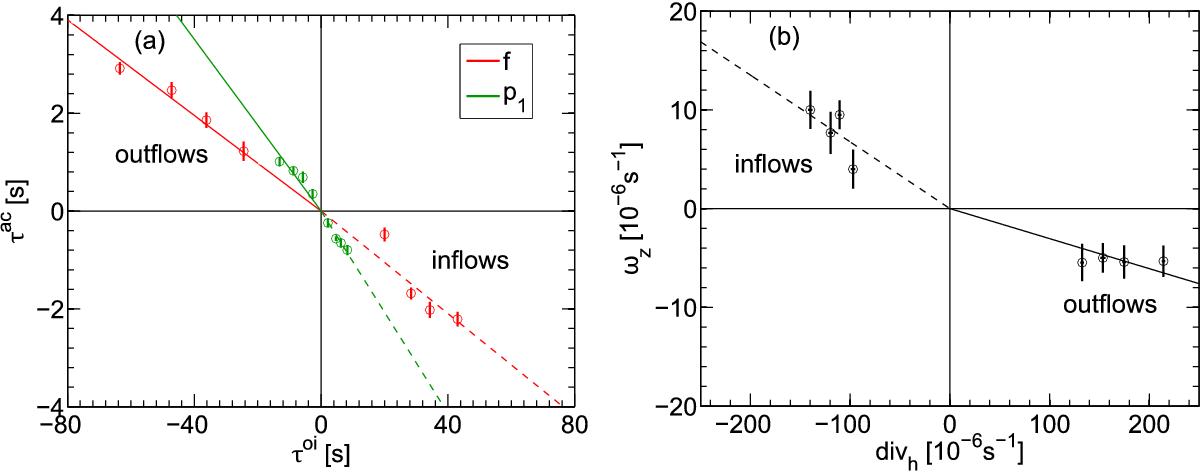
Vorticity as a function of divergence for the average supergranule at 40° latitude from HMI data. a) Vorticity travel times τac versus divergence travel times τoi for TD f modes and p1 modes. The upper left quadrant shows the values for the average outflows, the lower right quadrant for the average inflows. The solid and the dashed lines show least-squares fits of a linear function through the origin for outflows and inflows, respectively. The error bars were obtained by dividing the 336 datasets into eight parts. b) As a) but the peak ωz versus the peak divh from LCT is shown. We note that the quadrants depicting outflows and inflows are flipped compared to the travel times in a).
Current usage metrics show cumulative count of Article Views (full-text article views including HTML views, PDF and ePub downloads, according to the available data) and Abstracts Views on Vision4Press platform.
Data correspond to usage on the plateform after 2015. The current usage metrics is available 48-96 hours after online publication and is updated daily on week days.
Initial download of the metrics may take a while.