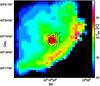
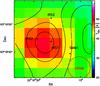
Fig. 13
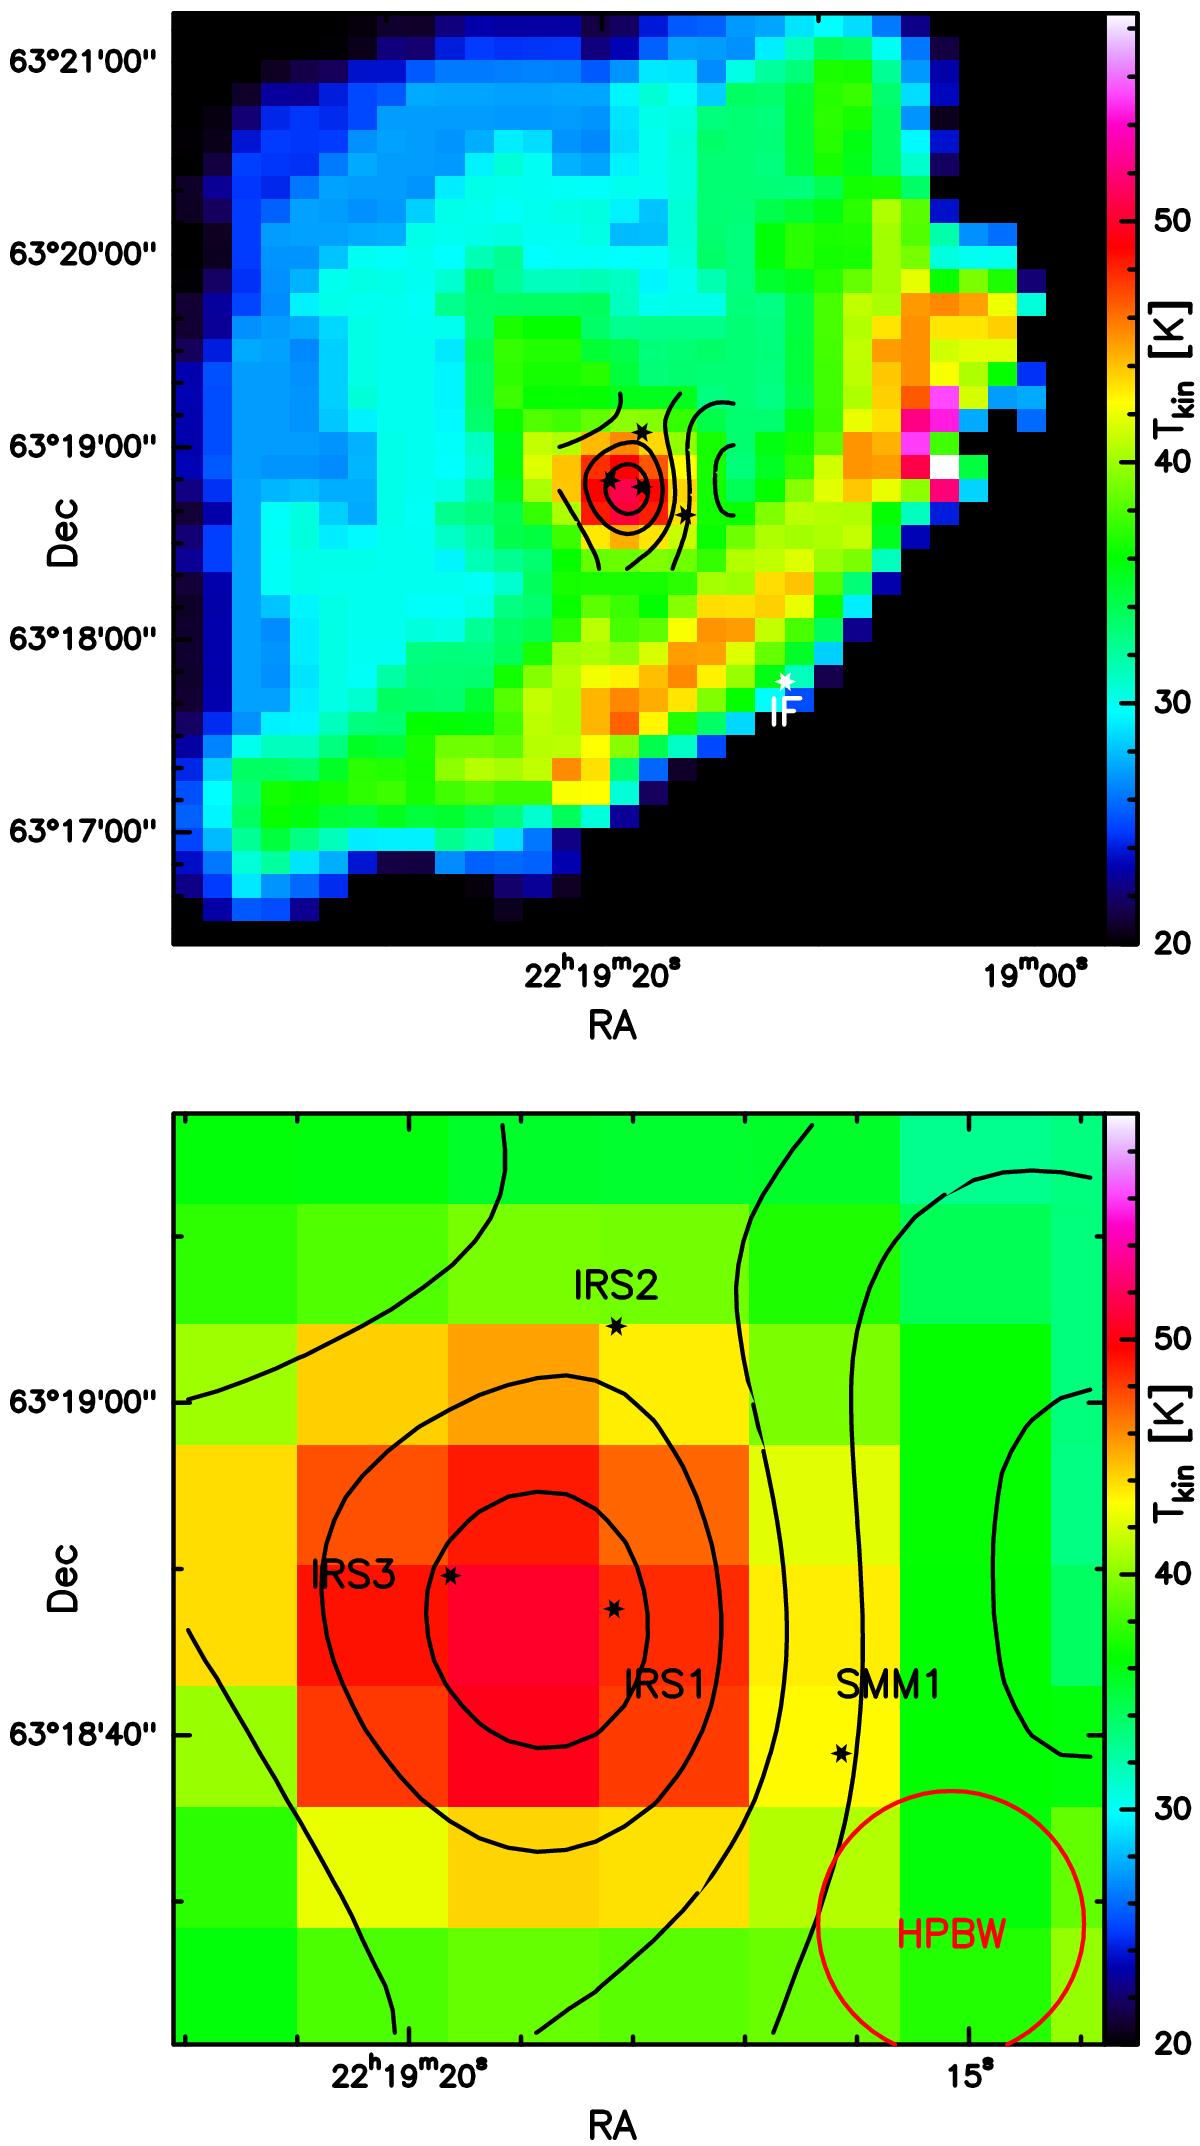
Gas kinetic temperature map toward the IRAM field (low-J analysis) with overplotted contours of dust temperatures (top) and zoomed in PACS field (bottom). The levels of contours are 55 K (inner) until 35 K (outer) using steps of 5 K. The color bar indicates the values of kinetic temperature. The 2 temperatures from this analysis seem to agree well, but the gas kinetic temperatures are underestimated for ~7−12 K (Fig. 10).
Current usage metrics show cumulative count of Article Views (full-text article views including HTML views, PDF and ePub downloads, according to the available data) and Abstracts Views on Vision4Press platform.
Data correspond to usage on the plateform after 2015. The current usage metrics is available 48-96 hours after online publication and is updated daily on week days.
Initial download of the metrics may take a while.