| Issue |
A&A
Volume 580, August 2015
|
|
|---|---|---|
| Article Number | A55 | |
| Number of page(s) | 9 | |
| Section | Planets and planetary systems | |
| DOI | https://doi.org/10.1051/0004-6361/201425444 | |
| Published online | 30 July 2015 | |
Photochemical response to the variation of temperature in the 2011−2012 stratospheric vortex of Saturn
1 Max Planck Institute for Solar System Research, Justus-von-Liebig-Weg 3, 37077 Göttingen, Germany
e-mail: This email address is being protected from spambots. You need JavaScript enabled to view it.
2 Univ. Bordeaux, LAB, UMR 5804, 33270 Floirac, France
3 CNRS, LAB, UMR 5804, 33270 Floirac, France
4 Atmospheric, Oceanic and Planetary Physics, Department of Physics, University of Oxford, Clarendon Laboratory, Parks Road, Oxford OX1 3PU, UK
5 Institut des Sciences Moléculaires, UMR 5255, CNRS-Université de Bordeaux, 351 cours de la libération, 33405 Talence Cedex, France
Received: 2 December 2014
Accepted: 16 June 2015
Abstract
Context. A hot vortex formed in the stratosphere of Saturn following the 2010−2011 Northern Storm. Huge temperature increases have been measured in the vortex around the millibar level. Enhancements in hydrocarbon abundances have been observed at the millibar level in 2011−2012 inside this vortex.
Aims. We model the time-dependent photochemistry inside the vortex by accounting for the temperature variability over the period from January 2011 to March 2012 to assess whether photochemistry alone can explain the enhancements seen in the hydrocarbon abundances.
Methods. We used a 1D time-dependent photochemical model of Saturn and adapted it to the perturbed conditions of the vortex after validating it in quiescent conditions.
Results. Our model predicts non-variability for ethane (C2H6) and acetylene (C2H2) and an increase in ethylene (C2H4) by a factor of 3 in the mbar region. Heavier hydrocarbons show a stronger variability than the lighter ones. We are unable to reproduce the increase seen in C2H2 , and we significantly underestimate the increase seen in C2H4.
Conclusions. Pure photochemistry does not explain the variability seen in the abundance of most hydrocarbons. This means that dynamics (eddy diffusion and/or advection) must have played a significant role in shaping the vertical profiles of the main hydrocarbons.
Key words: planets and satellites: individual: Saturn / planets and satellites: atmospheres / planets and satellites: composition / planets and satellites: physical evolution
© ESO, 2015
1. Introduction
Since 1876, astronomers have witnessed one planetary-scale storm in the atmosphere of Saturn every orbital cycle (Sánchez Lavega 1982). Five of these storms have been observed between 1876 and 1990, alternately at the equator and at northern mid-latitudes. How these tropospheric storms form remains unconstrained so far, although models suggest that moist convection in the water cloud layer triggers them (Hueso & Sánchez-Lavega 2004). The storm in 1990, referred to as “The Great White Spot”, quickly encircled the whole planet around the equator and was observed for several months (Sánchez-Lavega et al. 1991). Following this cycle, the next major storm in Saturn was predicted to appear around 2020. However, December 2010 unexpectedly saw the rise of what would become the longest thunderstorm ever witnessed in the atmosphere of Saturn to date (Sánchez-Lavega et al. 2011; Fischer et al. 2011; Fletcher et al. 2011). The initial spot expanded in a matter of a few days to a size of 8000 km (Sánchez-Lavega et al. 2011), and zonal winds then redistributed material with longitude. The cloud features associated with the storm encircled the planet in only 55 days and lasted until July 2011 (Sánchez-Lavega et al. 2012; Sayanagi et al. 2013).
The storm in 2010 in the troposphere had consequences on the stratosphere in the 40°N region of Saturn. Two warm cells, referred to as “beacons” due to their higher infrared emission, were generated by the disturbance in January 2011, most probably due to mechanical forcing initiated by wave activity. One of these cells was located directly above the tropospheric storm head (Fletcher et al. 2011). These warm airmasses traveling at different velocities in the atmosphere of Saturn merged in late April 2011 to form a huge warm vortex, in which temperature increases of up to 80 K were recorded in the 2 mbar region in May 2011 (Fletcher et al. 2012a). Although continuously shrinking in longitude and cooling radiatively since July 2011, this huge anticyclonic vortex left an observable thermal signature still detectable as of 2014.
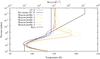 |
Fig. 1 Temperature and eddy diffusion coefficient profiles used in this study. The K(z) profile is plotted in black. The brown temperature profile comes from Guerlet et al. (2009) and corresponds to 15°S. We used this profile as our baseline profile to validate the model in quiescent conditions. The other profiles result from retrievals performed on measurements in the beacon at 40°N and are taken from Fig. 8a of Fletcher et al. (2012a). We used these profiles to model the temporal evolution of hydrocarbon abundances in the beacon, following the timeline presented in Fig. 4 (see Sect. 3). |
Infrared observations with Cassini/CIRS and ground-based facilities (Very Large Telescope, NASA Infrared Telescope Facility, McMath-Pierce Telescope) have allowed us to monitor the evolution of stratospheric temperatures and hydrocarbon abundances (Fletcher et al. 2012a; Hesman et al. 2012, 2013b, 2015). Acetylene and ethylene have seen their ~2 mbar mole fractions increase by a factor of ~3 and ~100, respectively, at the time of the merging of the two beacons, while the mole fraction of ethane remained mostly unchanged, to within the levels of uncertainty on the spectral inversions. Whether the changes in the hydrocarbon chemistry are caused by dynamics or photochemistry (or a combination of both) remains unresolved.
An explanation for the changes in the chemical composition could be isolated beacon air mass adiabatically descending from submicrobar to millibar levels, where the relative abundances of the observed hydrocarbons are in the correct order of magnitude with respect to post-merger observations at ~2 mbar. This descent of air masses would generate adiabatic heating and could thus explain the temperature increase seen in the beacon as well. However, simple 1D calculations show that an increase in temperature of ~80 K can only be caused by adiabatic heating at ~2 mbar for beacon air masses descending from the ~0.5 mbar level, but not from higher up in the stratosphere. This descent is consistent with the observed descent of the peak temperatures measured post-merger by Fletcher et al. (2012a), but is inconsistent with the observed changes in the hydrocarbon abundances (Hesman et al. 2012, 2015). Additional mechanisms such as horizontal expansion during the vertical compression may help keeping the temperature increase in line with observations while enabling the descent of air masses from altitudes higher than the 0.5 mbar level. As suggested by Fletcher et al. (2012a), the observed stratospheric heating could also be caused by the deposition in the stratosphere of energy from tropospheric gravity waves triggered by the storm. We note, however, that the merger of the beacons coincided with a downward shift of the peak temperatures, which is suggestive of dynamic subsidence from ~0.5 to ~2 mbar. This indicates that dynamics and adiabatic heating have most probably played a role in the temperature increase. Three-dimensional motion computations are thus desirable to examine this problem and to find the cause of the downward displacement post-merger.
In this paper, we address the hydrocarbon abundance variability in the beacon caused by the temperature changes within the vortex to assess whether photochemistry played any role in the hydrocarbon abundance changes seen at the mbar level. While the steady-state 1D photochemistry of Saturn is quite extensively documented (Moses et al. 2000a,b, 2005; Ollivier et al. 2000; Dobrijevic et al. 2011), the effect of sporadic thermal changes like those observed in the stratospheric beacon of Saturn have never been studied before. With this paper, we aim at presenting a methodology to take into account the temperature changes that occurred inside the beacon in photochemical computations. We apply this methodology to quantify the temporal and altitudinal variability of hydrocarbon abundances during the very unusual beacon thermal conditions from January 2011 until March 2012. We note that the purpose of this model is not to explain the dramatic temperature rise observed in the stratosphere of Saturn, but rather to assess whether temperature-dependent photochemistry can account for the uneven enhancements in hydrocarbons observed within the vortex. In Sect. 2, we present our photochemical model and its validation for Saturn in quiescent conditions. In Sect. 3, we present our methodology for photochemical computations applied to the beacon temperature conditions. In Sect. 4, we assess whether the temporal evolution of the hydrocarbon abundances observed in the stratospheric vortex can be caused by chemistry alone. We conclude in Sect. 5.
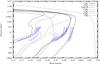 |
Fig. 2 Vertical profiles of acetylene (C2H2, solid), ethane (C2H6, long dashed), methylacetylene (CH3C2H, short dashed), propane (C3H8, dotted), diacetylene (C4H2, long dash-dotted), ethylene (C2H4, short dash-dotted), and methane (CH4, double dashed lines). The black line represents our computation results under the quiescent atmospheric conditions at 15°S. The profiles retrieved by Guerlet et al. (2009, 2010), with associated one-sigma uncertainties shown to the right and left of the derived profiles, are plotted in blue. There are no observational data for C2H4 in quiescent conditions. |
2. Photochemical model of Saturn in quiescent conditions
2.1. Short description of the model
The 1D time-dependent photochemical model we used is derived from the models previously developed by Dobrijevic et al. (2010, 2011). The baseline thermal profile we used to validate our model in quiescent conditions is taken from Guerlet et al. (2009) and corresponds to a latitude of 15° S. This latitude corresponds to the subsolar latitude in this dataset. We used the eddy diffusion coefficient profile K(z) from Dobrijevic et al. (2011). Both are shown in Fig. 1. The deep mole fractions of H2, He, and CH4 were fixed to 0.8603, 0.1350 (Conrath & Gautier 2000), and 0.0047 (Fletcher et al. 2009), respectively. The external flux of atomic hydrogen was set to 1 × 108 cm-2 s-1 (Moses et al. 2005). Our chemical scheme comes from Dobrijevic et al. (2014). The complete list of the reactions is available upon request and can be downloaded from the KIDA database (Wakelam et al. 2012).
2.2. Validation in quiescent conditions
The goal of the study is to assess whether thermally perturbed photochemistry can explain the evolution seen in the abundances of the main hydrocarbons in the beacon of Saturn. However, before running the code in the perturbed and time-dependent conditions representative of the beacon, we first checked that the mole fraction profiles computed with our model agree well with the vertical profiles of hydrocarbons as retrieved from Cassini/CIRS limb scans by Guerlet et al. (2009, 2010).
The comparison of our computations in quiescent conditions with data from Guerlet et al. is displayed in Fig. 2. The agreement is excellent for ethane (C2H6) and acetylene (C2H2), and remains within the one-sigma error bar of the measurements in most of the altitude range for propane (C3H8) and diacetylene (C4H2). Only our nominal methylacetylene (CH3C2H) profile deviates from the observations by a factor of ~3 in the measurement range, but it remains within the error bars of models (Dobrijevic et al. 2011). Indeed, the chemistry of C≥3 species is still quite uncertain. Interestingly, a similar offset between model and observations is found in the atmosphere of Uranus for this particular species (Orton et al. 2014), probably for the same reason. We note that there are no such observations outside the storm region for ethylene (C2H4) because this species is very difficult to observe in Saturn (Encrenaz et al. 1975). We therefore cannot really estimate the validity of our ethylene profile, but we checked that our profile was equally valid to the pre-storm profile from Hesman et al. (2012). The two profiles agree reasonably well. The latitude we chose for the validation of the model (15°S) is the subsolar latitude at the time of the observations of Guerlet et al. (2009), but is not the storm latitude. The equatorial region is known for being dynamically active. It is perturbed by a thermal oscillation (Fouchet et al. 2008; Orton et al. 2008; Guerlet et al. 2011) and possibly by a seasonally reversing Hadley cell (Friedson & Moses 2012). However, the changes since the southern summer observations of Guerlet et al. (2009) are negligible at 15°S (see Fig. 3 of Sinclair et al. 2013) probably because of the long dynamical timescales; the changes are much weaker than model uncertainties (Dobrijevic et al. 2003, 2011). At the storm latitude, the changes in abundances are more significant than at 15°S, but are still well below model uncertainties: they do not exceed 25% increases for C2H2 and C2H6 (Sinclair et al. 2013). We also checked that our model agreed fairly well with the data from Guerlet et al. (2009) at other pre-storm latitudes. Our K(z) is thus a good approximation for a disk average. Our model can then be considered as validated in 1D for hydrocarbons in quiescent conditions of Saturn. We note that our model, like any other 1D photochemical model of Saturn (e.g., Moses & Greathouse 2005; Guerlet et al. 2009, 2010), is not able to reproduce the latitudinal distributions of these species seen in the data of Howett et al. (2007), Hesman et al. (2009), Guerlet et al. (2009, 2010), and Sinclair et al. (2013). However, because our main focus is the comparison of photochemical simulations at a precise and isolated location in Saturn, that is, the beacon, a 1D model seems sufficient.
We stress that the work undertaken in studies of the atmosphere of Titan to revise and complete our previous chemical network (Hébrard et al. 2006, 2007, 2009, 2013; Dobrijevic et al. 2014; Loison et al. 2015), which follows the methodology described in Fig. 1 of Loison et al. (2015), has enabled significant improvements in the quality of the fits to the CIRS profiles (compare Figs. 3−5 of Dobrijevic et al. 2011 with Fig. 2 in this paper). We add that with our most recent chemical network (Dobrijevic et al. 2014) and this validation work (Fig. 2), we have also built a new reduced chemical scheme following the recipe of Dobrijevic et al. (2011) to apply it to 2D and 3D photochemical computations for Saturn. This reduced scheme is presented in detail and used in Hue et al. (2015a,b).
3. Time-dependent photochemistry in the beacon
In the following section, we use our 1D time-dependent photochemical model to study the variability of hydrocarbon abundances due to the increase of temperature inside the beacon. Because observations of the spatial distribution of temperature and the acetylene mole fraction as a function of latitude and/or longitude (Fletcher et al. 2012a) indicate that the vortex is dynamically isolated from the surrounding atmosphere, the use of a 1D model seems relevant as a first approximation.
To account for the temporal evolution of thermal conditions inside the beacon, we modified the temperature profile several times during the simulation. This made it necessary to adopt a specific procedure to follow the evolution of hydrocarbon abundances as a function of time. This procedure is presented as a flowchart in Fig. 3. We first ran our model with an initial temperature profile that is representative of quiescent conditions in the atmosphere of Saturn at 40°N until a steady state was reached for all compounds and altitudes. Then, we modified the temperature profile as a function of time to simulate the effect of the temperature evolution on abundances inside the beacon. The temperature profiles and timeline we adopted are presented in Figs. 1 and 4. We assumed that the atmosphere is in hydrostatic equilibrium during the interval of time between two modifications. The integration time step is such that it is initiated at a low value and can never exceed a tenth of the relevant total time interval. Between two consecutive steps, we recomputed the chemical rate constants and the actinic flux with the new temperatures and species distributions. We also re-interpolated the temperature, pressure, and abundance profiles on our fixed altitudinal grid so that the abundance profiles of step i remained compatible with those computed at the end of step i − 1 (see Fig. 5).
Our 1D model does not allow us to follow the evolution of the two initial beacons independently before their merging in April 2011. In our simulations, we only considered one beacon from January 2011 until mid-March 2011. After April 2011, the beacon of our model corresponds to the merged beacons. Therefore, the results at step 1 should not be used for comparison with pre-merger beacon data.
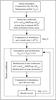 |
Fig. 3 Procedure used to introduce the evolution of temperature inside the beacon in the photochemical model. For simplicity, only two-body rate coefficients are presented in this flowchart. The same Arrhenius coefficients are used after each temperature profile modification. |
 |
Fig. 4 Timeline of the model for the temperature within the beacon, showing at which time the temperature profile is changed and how long this modification lasts in the model. We assume that the temperature profile remains unchanged between two consecutive steps. The corresponding temperature profiles are shown in Fig. 1. |
The rate coefficients used in our chemical scheme are temperature dependent. At each step of our simulation timeline, we thus re-computed rate coefficients for two-body, three-body, and radiative association reactions. Rate coefficients for two-body reactions are given by the modified Arrhenius equation: 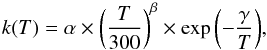 (1)where T is the temperature in Kelvin and k(T) is the rate coefficient in cm3s-1. In the following, α, β, and γ are named the Arrhenius coefficients. Rate coefficients for three-body reactions are given by the Troe formula (Troe 2003):
 ![Mathematical equation: \begin{equation} k(T) = \frac{k_0(T)[M]}{1+\frac{k_0(T)[M]}{k_{\infty}(T)}}\times u, \end{equation}](/articles/aa/full_html/2015/08/aa25444-14/aa25444-14-eq22.png) (2)where
(2)where ![Mathematical equation: \begin{equation} \log{u} = {\frac{\log{F_{\rm c}}}{1+\left[\frac{\log\left( \frac{k_0(T)[M]}{k_{\infty}}\right)}{N}\right]^2}} \end{equation}](/articles/aa/full_html/2015/08/aa25444-14/aa25444-14-eq23.png) (3)with Fc = 0.64 and N = 0.75 − 1.27log Fc and [M] is the concentration of a third body (H2 and He in the present case). The low-pressure limit rate constant and the high-pressure limit rate constant, k0(T) and k∞(T), respectively, follow the modified Arrhenius equation with the respective Arrhenius coefficients α0, β0 et γ0 and α∞, β∞ et γ∞. For radiative association reactions, we used the formulation from Hébrard et al. (2013):
(3)with Fc = 0.64 and N = 0.75 − 1.27log Fc and [M] is the concentration of a third body (H2 and He in the present case). The low-pressure limit rate constant and the high-pressure limit rate constant, k0(T) and k∞(T), respectively, follow the modified Arrhenius equation with the respective Arrhenius coefficients α0, β0 et γ0 and α∞, β∞ et γ∞. For radiative association reactions, we used the formulation from Hébrard et al. (2013): ![Mathematical equation: \begin{equation} k(T) = \frac{ k_0(T)[M]u+k_{\rm r} }{{1+\frac{k_0(T)[M]}{k_{\infty}(T)}}}\cdot \end{equation}](/articles/aa/full_html/2015/08/aa25444-14/aa25444-14-eq35.png) (4)The radiative emission rate coefficient kr(T) follows the modified Arrhenius equation with Arrhenius coefficients αr, βr et γr.
(4)The radiative emission rate coefficient kr(T) follows the modified Arrhenius equation with Arrhenius coefficients αr, βr et γr.
We did not investigate the uncertainties on the results induced by the propagation of uncertainties on the reaction rates. The problem is much more complex than in a steady atmosphere, for which the methodology of Dobrijevic et al. (2003) can be used. In their work, uncertainties were propagated using the simple expression log k = log k0 ± log F, where k0 is the nominal value and F the uncertainty factor. Because we study an atmosphere in which the temperature evolves with time, the propagation of uncertainties should be initiated directly on the α, β, and γ parameters. These parameters are not independent and the variance-covariance matrices are generally not known (see Hébrard et al. 2009). Estimating the uncertainties in a meaningful way is therefore not possible at this stage.
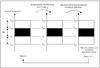 |
Fig. 5 Re-interpolation scheme used for hydrocarbon mole fraction profiles between two consecutive steps of our simulation timeline. |
We also accounted for the variation of the subsolar point with time in the computation of the photodissociation rates. The subsolar point varies from 7.6° to 13.5° from January 1, 2011, to March 15, 2012. However, the diurnally averaged zenithal angle only varies from 55.8° to 57.5°.
We kept the K(z) profile constant for all times because our focus is on chemistry and not on the dynamics. The coupled effects of chemistry and dynamics on the abundances of hydrocarbons in the beacon were discussed in Moses et al. (2014). We kept the main composition of the atmosphere, that is, the H2, He, and CH4 deep mole fractions, and the influx of H atoms unchanged with respect to quiescent conditions.
4. Results
In Fig. 6, we present the temporal evolution inside the beacon of some of the main hydrocarbons (except methane) as obtained with our 1D photochemical model. The chemical evolution timescales are longer than the steps of our timeline, so that steady state is never reached during the perturbed phase. A first obvious trend is that the heavier the molecule, the more significant the relative variation. The production region of C2H2 and C2H6 resides above the pressure range where the temperature is perturbed inside the beacon, implying no significant abundance variability in the 1 mbar region. The situation is more complex for C2H4, where two production peaks are found. The first one is at high altitude, like C2H2 and C2H6 for the same reason, but there is also a second peak centered around 1 mbar that is caused by the temperature increase in the beacon (see Sect. 4.2). The mole fraction of CH3C2H is reduced in the whole pressure range from 10-3 to 10 mbar due to the temperature perturbation.
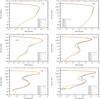 |
Fig. 6 Vertical profiles of C2H2 (top left), C2H6 (top right), C2H4 (center left), CH3C2H (center right), C3H6 (bottom left), and C4H2 (bottom right), as a function of the timeline steps presented in Fig. 4. |
From one step to another at any given pressure level, both (i) the total production and loss rates and (ii) the importance of the reactions evolve due to (a) the change of the column density above that level (for photolysis) and (b) the change in the temperature and total density at that level. In the next paragraphs, we describe more quantitatively the main processes that lead to perturbations of the hydrocarbon vertical profiles seen in Fig. 6 at 1 mbar and between the steps 0 and 3 caused by the beacon temperature perturbations.
4.1. C2H6
The production of C2H6 in the stratosphere is mainly due to the three-body reaction  (5)which is not very sensitive to the temperature. Taking into account the decrease of the total number density, its rate constant therefore only varies from step 0 to step 3 by a factor of 0.86. The main loss process of C2H6 is the photolysis, which also decreases from step 0 to step 3. As a consequence, this species is not significantly photochemically sensitive to the perturbations of the temperature and number density inside the storm.
4.2. C2H4
The production of C2H4 around 1 mbar at step 0 is dominated by the photolysis of C2H6 and the three-body reactions  (6)followed by
  (7)The main loss-processes of C2H4 are photolysis and the three-body reaction
  (8)At step 3, the main loss processes are the same, whereas the reaction
  (9)contributes to 93% to the production of C2H4. The rate constant of this reaction is
  (10)according to Knyazev et al. (1996) and Callear & Smith (1986). At 1 mbar, the temperature changes from 143.4 K (step 0) to 204.18 K (step 3), and consequently, the rate of this reaction increases by a factor of 80. At this pressure level, the total density decreases from 5.06 × 1016 cm-3 to 3.58 × 1016 cm-3, which reduces the relative importance of three-body reactions, like the loss reaction of C2H4 (reaction 8). Moreover, the k0 of reaction (7) decreases with increasing temperature, since
 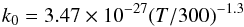 (11)according to Monks et al. (1995) and Klippenstein & Harding (1999). This favors the increase of C2H3 and thus enhances the relative importance of reaction 9 in the production of C2H4. The increase of C2H4 production caused by reaction 9 is much greater than the increase of the C2H4 loss due to reaction 8 (and additionally there is a limited decrease of photolysis), which explains the abundance peak seen at 1 mbar for C2H4. It should be noted that the increase by a factor of ~3 of C2H4 around 1 mbar represents a very small fraction of the total hydrocarbon production at this altitude and corresponds in fact to a small transfer from C2H2 to C2H4.
4.3. C2H2
The net C2H2 production comes from the photolysis of C2H4. However, at 1 mbar, C2H2 is more abundant than C2H4, the abundance of C2H2 being dominated by transport and recycling reactions. These recycling cycles are  (12)followed by
  (13)and
  (14)followed by
  (15)As these reactions are recycling, the effect of temperature on C2H2 abundance is low. Indeed, the main C2H2 loss is the reaction
  (16)followed by
  (17)The three-body reaction 16 increases by a factor of 3 between step 0 and step 3, and reaction 17 strongly increases with temperature. Then some C2H2 is transformed into C2H4, which leads to an increase of C2H4 and a tiny decrease of C2H2 (by a factor <1.1 at 1 mbar).
4.4. C4H2
Around 1 mbar, C4H2 is produced through the reaction  (18)Its photolysis (which leads to C4H and then back to C4H2 through the C4H + CH4 and C4H + H2 reactions) and the reaction
  (19)are the main consumption pathways of C4H2.
The decrease of C4H2 photolysis only has a weak effect on the C4H2 abundance as its main products (C4H2∗ and C4H) lead back to C4H2. The photolysis of C2H2 decreases by a factor of about 5 at 1 mbar between step 0 and step 3 and the main C2H consumption, the C2H + H2 − → C2H2 + H reaction, has a rate constant equal to k(T) = 1.2 × 10⁻¹¹exp( − 998 /T), according to Opansky & Leone (1996), which increases by a factor of 8 with temperature between step 0 and step 3. Then, the effect on C2H2 is weak, but the C2H abundance strongly decreases, which, in turn, leads to a strong decrease of C4H2 production. As a result, the C4H2 abundance decreases notably in the model.
4.5. CH3C2H
The production and loss of this species is mainly controlled by a chemical cycle involving C3H3. Around 1 mbar, for instance, the main reaction accounting for the production of CH3C2H is the three-body reaction,  (20)and the loss is dominated by its photolysis,
  (21)At step 3, the three-body reaction
  (22)is the main loss-process. The rate constant of this reaction increases by a factor of about 13 between step 0 and step 3 because it has a barrier, whereas the rate constant of reaction 20 remains almost unchanged because this one has no barrier.
As a consequence, the physical conditions inside the beacon favor the consumption of CH3C2H in the major part of the stratosphere and lead to a decrease by almost a factor of 10 of its mole fraction in the mbar pressure range.
4.6. C3H6
The situation for C3H6 is quite complicated, with its abundance alternatively increasing and decreasing as a function of altitude. For pressures in the range of 1 to 5 mbar, for instance, the production of C3H6 involves the three-body reactions 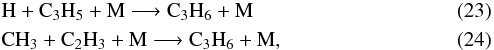 where C3H5 comes from
  and the following cycling process
  And C2H3 mainly comes from
  (29)As a consequence, the decrease of CH3C2H and C2H2 from step 0 to step 3 in that region favors the decrease of C2H3 and C3H5 and consequently C3H6, although the photolysis of C3H6 also decreases from step 0 to step 3. At higher pressures in the atmosphere, the main production process of C3H6 at step 0 and step 3 is very different since it is mainly due to the photolysis of C3H8, which is produced by
  (30)The main consumption of C3H6 is always photodissociation, which leads not only to C3H5 (leading back to C3H6), but also to CH3, C2H3, etc. Photolysis processes decrease with temperature because of the variation of total density, which compensates for the decrease of C3H6 production. As a result of the various effects, C3H6 is not significantly affected by the perturbation.
5. Discussion and conclusion
We have developed a 1D photochemical model to simulate the chemical response to the increase of temperature in the beacon of Saturn between January 2011 and March 2012 to compare with observations. The chemical network used in this study is the result of a considerable number of improvements to the chemistry, notably with respect to the influence of association reactions and their temperature dependence (Hébrard et al. 2013). This network, tested for the first time in this work on the quiescent atmosphere of Saturn, provides a significant advance with respect to the previous models in the fitting of the CIRS data (Fig. 2).
In the beacon, we find that the extreme increase of temperature around the mbar level observed by Fletcher et al. (2011, 2012a) has no significant effect on the abundances of C2H2 and C2H6 in this pressure range. This can be simply explained by the fact that the production region of these compounds is higher up in the stratosphere (around the 10-4 mbar level) where methane is photolysed. At these altitudes, temperatures are barely altered in our beacon model. However, this might not be true. The profiles of Fletcher et al. (2012a) are indeed only valid for p> 0.5 mbar, and while the decrease seen in the temperature at p< 2 mbar is real, we do not know the behavior of the temperature profile at lower pressures. Lower in the stratosphere, there is no significant increase or decrease in production or loss, respectively. Our model even predicts a slight decrease (lower than 10%) of the mole fraction of C2H2 species in the 10-2–10-4 mbar pressure range. Our model therefore seems to be in line with the observed relative non-variability of ethane at the mbar level, but does not reproduce the increase seen for C2H2 reported by Fletcher et al. (2012a) at the same level.
Other observational constraints come from Hesman et al. (2012, 2015). They reported an increase of the abundance of C2H4 by two orders of magnitude in the mbar region from two independent observations. However, the retrievals of the C2H4 profile from the two measurements were not fully compatible. Our simulations suggest that chemistry alone can only account for an increase by a factor of ~3 between 0.1 and 10 mbar, peaking around 3 mbar. This is below the region where Hesman et al. (2012, 2015) claimed an increase by a factor of 100, and our profile is not compatible with the profiles they have retrieved. Other species like CH3C2H and C4H2 see their mole fraction decrease by up to one order of magnitude between 0.01 and 1 mbar. This is contradicted by observations of Hesman et al. (2013b), in which the abundances of these species were enhanced.
From a purely chemical point of view, our simulations show that the stratospheric composition of Saturn is altered by the unusual temperatures of the beacon. We have found that the chemical equilibrium in the beacon is globally shifted from the quiescent state to a perturbed state, mostly for heavy hydrocarbons. Analysis of the CIRS spectra of these heavier species could help to further constrain our chemical model results. However, the perturbations we see in the vertical profiles of the main hydrocarbon do not correspond to the observed perturbations. We are unable to explain the increase seen in C2H2 (Fletcher et al. 2012a). The increase we obtain for C2H4 is not sufficient to explain the observations of Hesman et al. (2012, 2015), although radiative transfer modeling of the observed lines with our profiles could help (in)validating our profile. Finally, we expect a decrease of the abundances of CH3C2H and C4H2 at 1 mbar from their chemical evolution, while an enhancement has been observed Hesman et al. (2013b). This means that chemistry alone cannot explain all the observations, and dynamics must have played a role in redistributing hydrocarbons in the beacon and its surroundings.
We have used the eddy profile derived by Dobrijevic et al. (2011) in quiescent conditions and applied it to the unusual thermal conditions of the beacon. It is very likely that the atmospheric disturbances inside the beacon modified the eddy profile locally. For instance, an increase of eddy diffusion between 0.1 μbar and 1 mbar would result in vertically smoothing the abundance profiles. The steeper the vertical gradient before the storm, the higher the increase in mole fraction around the mbar level in the beacon.
In addition, more complex circulation patterns with horizontal and vertical advection may also have played a significant role in shaping the distributions of hydrocarbons in the beacon. For instance, subsidence from adiabatic compression may also have contributed in increasing the C2Hx mbar abundances and temperature. According to our results, increases by a factor of 3 and 100 in the C2H2 and C2H4 abundances, respectively, at the mbar level can be obtained by transporting air masses from lower pressures (higher altitudes) by conserving mixing ratios over ~3 and ~10 scale heights, respectively. These numbers are significantly higher than the 1.4 scale height subsidence that was observed during the beacon merger (Fletcher et al. 2012a), and pure 1D adiabatic heating caused by this subsidence is highly incompatible with the peak temperature increase observed in the beacon. Additional processes such as horizontal expansion are therefore required to explain both the temperature and chemistry changes in the beacon. Following Moses et al. (2014) and Armstrong et al. (2014), Moses et al. (2015)1 moved beyond the problem identified in this paper (i.e., that photochemistry alone cannot explain the abundances measured in the beacon) and assessed the importance of variations in vertical mixing and winds in generating the observed enhancements in some species. In any case, complex 3D hydrodynamical simulations with general circulation models (e.g., Friedson & Moses 2012; Guerlet et al. 2014) are probably required to fully understand what caused such a dramatic evolution in the hydrocarbon abundances and temperatures inside the beacon.
It will also be interesting to see if oxygen compounds that were already observed from the ground (Cavalié et al. 2009, 2010) and from space (Feuchtgruber et al. 1997; Hartogh et al. 2009; Fletcher et al. 2012b), have significantly altered abundances in the beacon, as suggested by Cavalié et al. (2012) and Hesman et al. (2013a). Their observation, along with the observations of hydrocarbons and temperature, will help building a more comprehensive picture of what happened in the northern stratosphere of Saturn in 2011−2012.
Moses et al. used a different chemical scheme, but the results they presented in a previous work (Moses et al. 2005), which are valid for quiescent conditions, agree in general with those presented here.
Acknowledgments
L. Fletcher was supported by a Royal Society Research Fellowship at the University of Oxford. T. Cavalié wishes to thank F. Hersant for useful discussions. We thank the two anonymous referees for their useful comments that helped us improve our manuscript.
References
- Armstrong, E. S., Moses, J. I., Fletcher, L. N., et al. 2014, in AAS/Division for Planetary Sciences Meeting Abstracts, 46, #422.21 [Google Scholar]
- Callear, A. B., & Smith, G. B. 1986, J. Phys. Chem., 90, 3229 [CrossRef] [Google Scholar]
- Cavalié, T., Billebaud, F., Dobrijevic, M., et al. 2009, Icarus, 203, 531 [NASA ADS] [CrossRef] [Google Scholar]
- Cavalié, T., Hartogh, P., Billebaud, F., et al. 2010, A&A, 510, A88 [NASA ADS] [CrossRef] [EDP Sciences] [Google Scholar]
- Cavalié, T., Feuchtgruber, H., Hesman, B. E., et al. 2012, in AAS/Division for Planetary Sciences Meeting Abstracts, 44, #403.07 [Google Scholar]
- Conrath, B. J., & Gautier, D. 2000, Icarus, 144, 124 [NASA ADS] [CrossRef] [Google Scholar]
- Dobrijevic, M., Ollivier, J. L., Billebaud, F., Brillet, J., & Parisot, J. P. 2003, A&A, 398, 335 [NASA ADS] [CrossRef] [EDP Sciences] [Google Scholar]
- Dobrijevic, M., Cavalié, T., Hébrard, E., et al. 2010, Planet. Space Sci., 58, 1555 [NASA ADS] [CrossRef] [Google Scholar]
- Dobrijevic, M., Cavalié, T., & Billebaud, F. 2011, Icarus, 214, 275 [NASA ADS] [CrossRef] [Google Scholar]
- Dobrijevic, M., Hébrard, E., Loison, J. C., & Hickson, K. M. 2014, Icarus, 228, 324 [NASA ADS] [CrossRef] [Google Scholar]
- Encrenaz, T., Combes, M., Zeau, Y., Vapillon, L., & Berezne, J. 1975, A&A, 42, 355 [NASA ADS] [Google Scholar]
- Feuchtgruber, H., Lellouch, E., de Graauw, T., et al. 1997, Nature, 389, 159 [NASA ADS] [CrossRef] [PubMed] [Google Scholar]
- Fischer, G., Kurth, W. S., Gurnett, D. A., et al. 2011, Nature, 475, 75 [NASA ADS] [CrossRef] [EDP Sciences] [Google Scholar]
- Fletcher, L. N., Orton, G. S., Teanby, N. A., Irwin, P. G. J., & Bjoraker, G. L. 2009, Icarus, 199, 351 [NASA ADS] [CrossRef] [Google Scholar]
- Fletcher, L. N., Hesman, B. E., Irwin, P. G. J., et al. 2011, Science, 332, 1413 [NASA ADS] [CrossRef] [Google Scholar]
- Fletcher, L. N., Hesman, B. E., Achterberg, R. K., et al. 2012a, Icarus, 221, 560 [Google Scholar]
- Fletcher, L. N., Swinyard, B., Salji, C., et al. 2012b, A&A, 539, A44 [Google Scholar]
- Fouchet, T., Guerlet, S., Strobel, D. F., et al. 2008, Nature, 453, 200 [NASA ADS] [CrossRef] [Google Scholar]
- Friedson, A. J., & Moses, J. I. 2012, Icarus, 218, 861 [NASA ADS] [CrossRef] [Google Scholar]
- Guerlet, S., Fouchet, T., Bézard, B., Simon-Miller, A. A., & Michael Flasar, F. 2009, Icarus, 203, 214 [NASA ADS] [CrossRef] [Google Scholar]
- Guerlet, S., Fouchet, T., Bézard, B., et al. 2010, Icarus, 209, 682 [NASA ADS] [CrossRef] [Google Scholar]
- Guerlet, S., Fouchet, T., Bézard, B., Flasar, F. M., & Simon-Miller, A. A. 2011, Geophys. Res. Lett., 38, 9201 [NASA ADS] [CrossRef] [Google Scholar]
- Guerlet, S., Spiga, A., Sylvestre, M., et al. 2014, Icarus, 238, 110 [NASA ADS] [CrossRef] [Google Scholar]
- Hartogh, P., Lellouch, E., Crovisier, J., et al. 2009, Planet. Space Sci., 57, 1596 [NASA ADS] [CrossRef] [Google Scholar]
- Hébrard, E., Dobrijevic, M., Bénilan, Y., & Raulin, F. 2006, J. Photochem. Photobiol. C: Photochem. Rev., 7, 211 [CrossRef] [Google Scholar]
- Hébrard, E., Dobrijevic, M., Bénilan, Y., & Raulin, F. 2007, Planet. Space Sci., 55, 1470 [NASA ADS] [CrossRef] [Google Scholar]
- Hébrard, E., Dobrijevic, M., Pernot, P., et al. 2009, J. Phys. Chem. A, 113, 11227 [CrossRef] [PubMed] [Google Scholar]
- Hébrard, E., Dobrijevic, M., Loison, J. C., et al. 2013, A&A, 552, A132 [NASA ADS] [CrossRef] [EDP Sciences] [Google Scholar]
- Hesman, B. E., Jennings, D. E., Sada, P. V., et al. 2009, Icarus, 202, 249 [NASA ADS] [CrossRef] [Google Scholar]
- Hesman, B. E., Bjoraker, G. L., Sada, P. V., et al. 2012, ApJ, 760, 24 [NASA ADS] [CrossRef] [Google Scholar]
- Hesman, B. E., Bjoraker, G. L., Achterberg, R. K., et al. 2013a, in AAS/Division for Planetary Sciences Meeting Abstracts, 45, #312.12 [Google Scholar]
- Hesman, B. E., Bjoraker, G. L., Achterberg, R. K., et al. 2013b, AGU Fall Meeting Abstracts, C2205 [Google Scholar]
- Hesman, B. E., Bjoraker, G. L., Achterberg, R. K., et al. 2015, Icarus, submitted [Google Scholar]
- Howett, C. J. A., Irwin, P. G. J., Teanby, N. A., et al. 2007, Icarus, 190, 556 [NASA ADS] [CrossRef] [Google Scholar]
- Hue, V., Cavalié, T., Dobrijevic, M., Hersant, F., & Greathouse, T. K. 2015a, Icarus, 257, 163 [NASA ADS] [CrossRef] [Google Scholar]
- Hue, V., Greathouse, T. K., Cavalié, T., Dobrijevic, M., & Hersant, F. 2015b, Icarus, in revision [Google Scholar]
- Hueso, R., & Sánchez-Lavega, A. 2004, Icarus, 172, 255 [NASA ADS] [CrossRef] [Google Scholar]
- Klippenstein, S. J., & Harding, L. B. 1999, Phys. Chem. Chem. Phys., 1, 989 [CrossRef] [Google Scholar]
- Knyazev, V. D., Bencsura, A., Stoliarov, S. I., & Slagle, I. R. 1996, J. Phys. Chem., 100, 11346 [NASA ADS] [CrossRef] [Google Scholar]
- Loison, J. C., Hébrard, E., Dobrijevic, M., et al. 2015, Icarus, 247, 218 [NASA ADS] [CrossRef] [Google Scholar]
- Monks, P. S., Nesbitt, F L., Payne, W. A., et al. 1995, J. Phys. Chem., 99, 17151 [NASA ADS] [CrossRef] [Google Scholar]
- Moses, J. I., & Greathouse, T. K. 2005, J. Geophys. Res., 110, 9007 [CrossRef] [Google Scholar]
- Moses, J. I., Bézard, B., Lellouch, E., et al. 2000a, Icarus, 143, 244 [NASA ADS] [CrossRef] [Google Scholar]
- Moses, J. I., Lellouch, E., Bézard, B., et al. 2000b, Icarus, 145, 166 [NASA ADS] [CrossRef] [Google Scholar]
- Moses, J. I., Fouchet, T., Bézard, B., et al. 2005, J. Geophys. Res., 110, 8001 [NASA ADS] [CrossRef] [Google Scholar]
- Moses, J. I., Armstrong, E. S., Fletcher, L. N., et al. 2014, in AAS/Division for Planetary Sciences Meeting Abstracts, 46, #508.07 [Google Scholar]
- Moses, J. I., Armstrong, E. S., Fletcher, L. N., et al. 2015, Icarus, submitted [Google Scholar]
- Ollivier, J. L., Dobrijevic, M., & Parisot, J. P. 2000, Planet. Space Sci., 48, 699 [NASA ADS] [CrossRef] [Google Scholar]
- Opansky, B., & Leone, S. 1996, J. Phys. Chem., 100, 19904 [CrossRef] [Google Scholar]
- Orton, G. S., Yanamandra-Fisher, P. A., Fisher, B. M., et al. 2008, Nature, 453, 196 [NASA ADS] [CrossRef] [Google Scholar]
- Orton, G. S., Moses, J. I., Fletcher, L. N., et al. 2014, Icarus, 243, 471 [NASA ADS] [CrossRef] [Google Scholar]
- Sánchez Lavega, A. 1982, Icarus, 49, 1 [NASA ADS] [CrossRef] [Google Scholar]
- Sánchez-Lavega, A., Colas, F., Lecacheux, J., et al. 1991, Nature, 353, 397 [NASA ADS] [CrossRef] [Google Scholar]
- Sánchez-Lavega, A., del Río-Gaztelurrutia, T., Hueso, R., et al. 2011, Nature, 475, 71 [NASA ADS] [CrossRef] [Google Scholar]
- Sánchez-Lavega, A., del Río-Gaztelurrutia, T., Delcroix, M., et al. 2012, Icarus, 220, 561 [NASA ADS] [CrossRef] [Google Scholar]
- Sayanagi, K. M., Dyudina, U. A., Ewald, S. P., et al. 2013, Icarus, 223, 460 [NASA ADS] [CrossRef] [Google Scholar]
- Sinclair, J. A., Irwin, P. G. J., Fletcher, L. N., et al. 2013, Icarus, 225, 257 [NASA ADS] [CrossRef] [Google Scholar]
- Troe, J. 2003, Chem. Rev., 103, 4565 [CrossRef] [Google Scholar]
- Wakelam, V., Herbst, E., Loison, J.-C., et al. 2012, ApJS, 199, 21 [NASA ADS] [CrossRef] [Google Scholar]
All Figures
|
Fig. 1 Temperature and eddy diffusion coefficient profiles used in this study. The K(z) profile is plotted in black. The brown temperature profile comes from Guerlet et al. (2009) and corresponds to 15°S. We used this profile as our baseline profile to validate the model in quiescent conditions. The other profiles result from retrievals performed on measurements in the beacon at 40°N and are taken from Fig. 8a of Fletcher et al. (2012a). We used these profiles to model the temporal evolution of hydrocarbon abundances in the beacon, following the timeline presented in Fig. 4 (see Sect. 3). |
| In the text | |
|
Fig. 2 Vertical profiles of acetylene (C2H2, solid), ethane (C2H6, long dashed), methylacetylene (CH3C2H, short dashed), propane (C3H8, dotted), diacetylene (C4H2, long dash-dotted), ethylene (C2H4, short dash-dotted), and methane (CH4, double dashed lines). The black line represents our computation results under the quiescent atmospheric conditions at 15°S. The profiles retrieved by Guerlet et al. (2009, 2010), with associated one-sigma uncertainties shown to the right and left of the derived profiles, are plotted in blue. There are no observational data for C2H4 in quiescent conditions. |
| In the text | |
|
Fig. 3 Procedure used to introduce the evolution of temperature inside the beacon in the photochemical model. For simplicity, only two-body rate coefficients are presented in this flowchart. The same Arrhenius coefficients are used after each temperature profile modification. |
| In the text | |
|
Fig. 4 Timeline of the model for the temperature within the beacon, showing at which time the temperature profile is changed and how long this modification lasts in the model. We assume that the temperature profile remains unchanged between two consecutive steps. The corresponding temperature profiles are shown in Fig. 1. |
| In the text | |
|
Fig. 5 Re-interpolation scheme used for hydrocarbon mole fraction profiles between two consecutive steps of our simulation timeline. |
| In the text | |
|
Fig. 6 Vertical profiles of C2H2 (top left), C2H6 (top right), C2H4 (center left), CH3C2H (center right), C3H6 (bottom left), and C4H2 (bottom right), as a function of the timeline steps presented in Fig. 4. |
| In the text | |
Current usage metrics show cumulative count of Article Views (full-text article views including HTML views, PDF and ePub downloads, according to the available data) and Abstracts Views on Vision4Press platform.
Data correspond to usage on the plateform after 2015. The current usage metrics is available 48-96 hours after online publication and is updated daily on week days.
Initial download of the metrics may take a while.