Free Access
Fig. 3
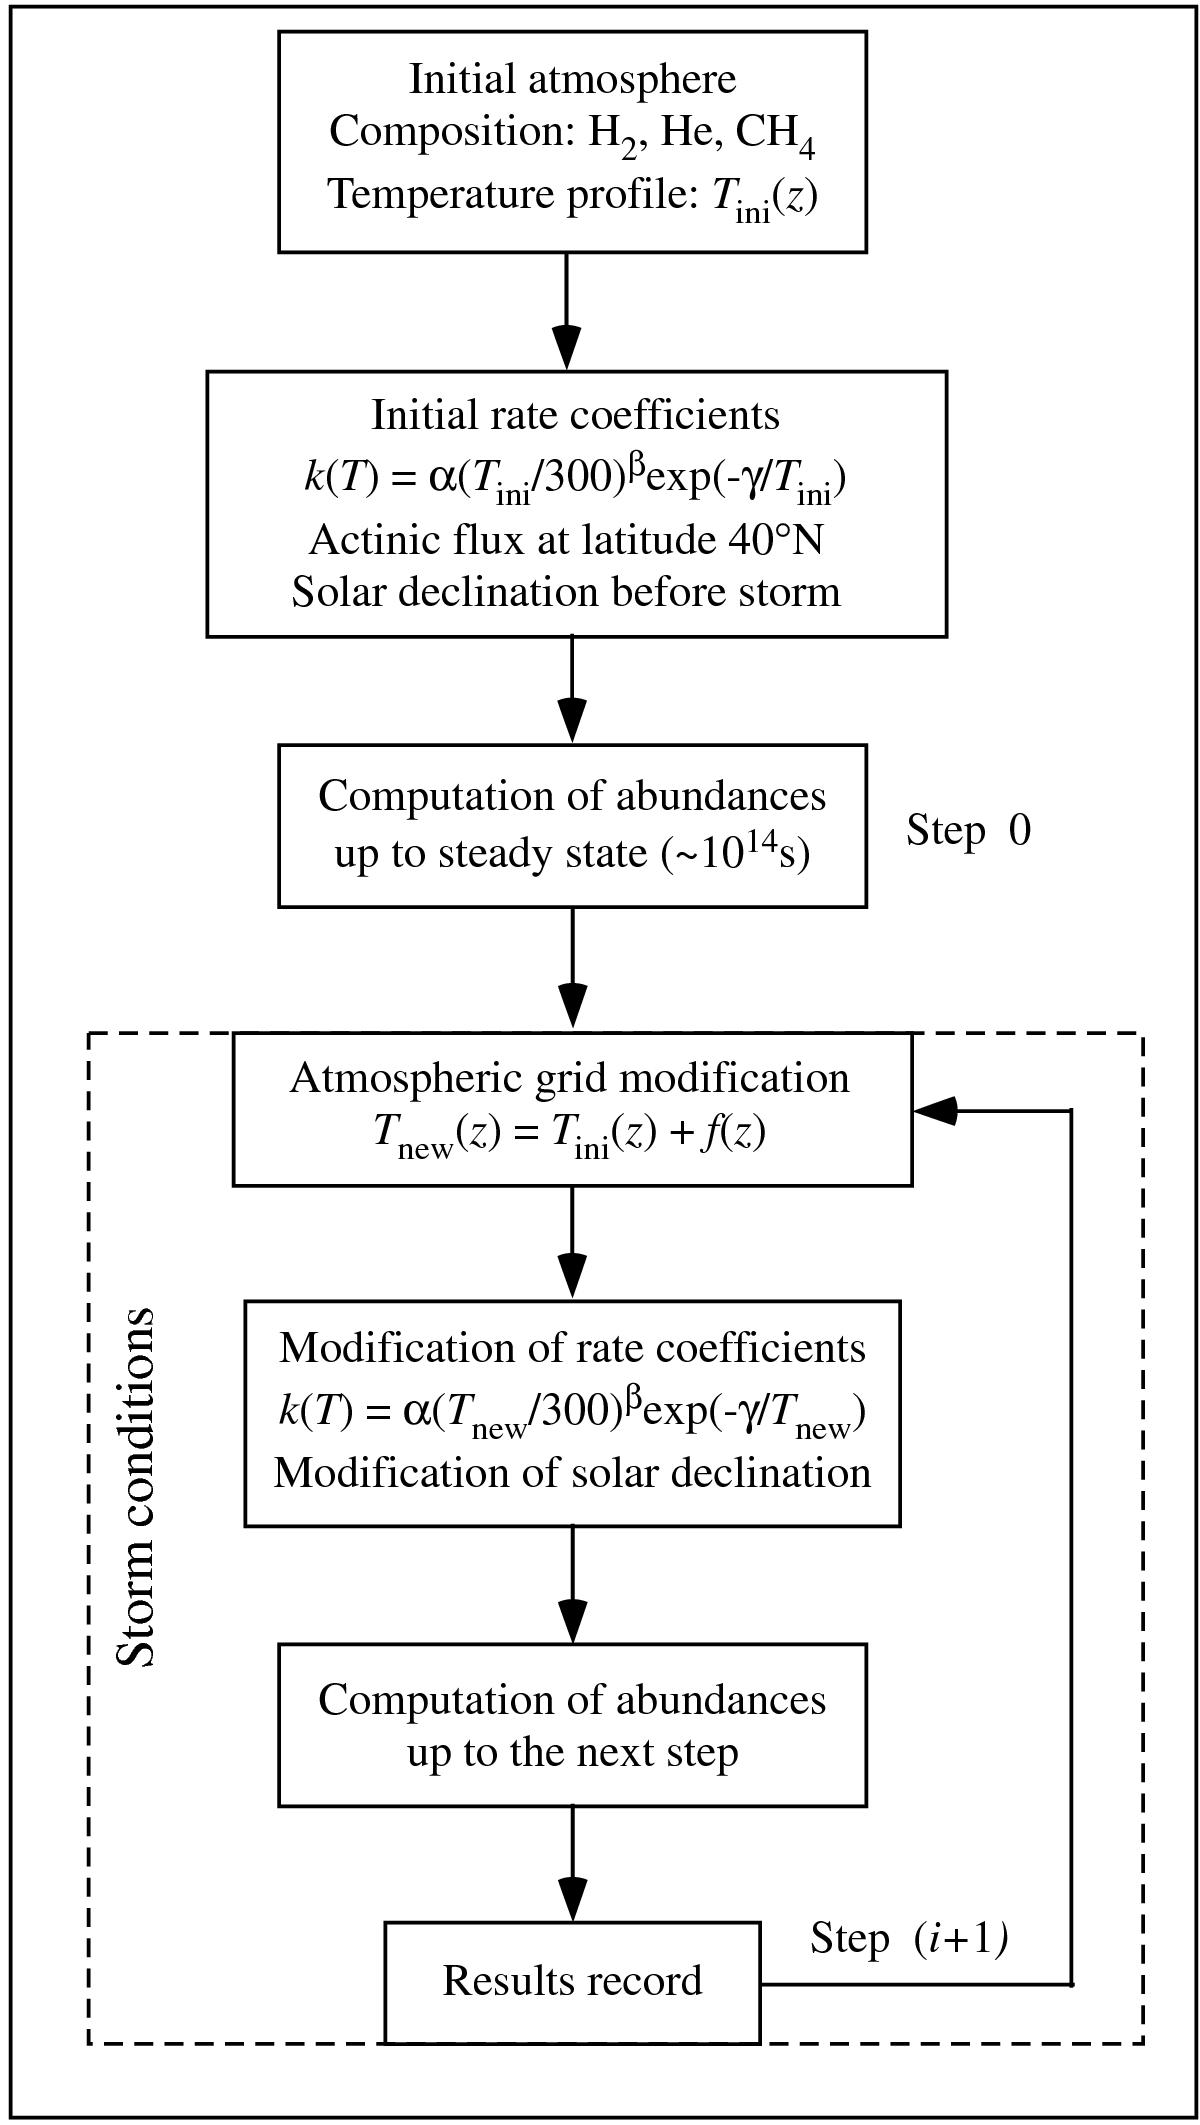
Procedure used to introduce the evolution of temperature inside the beacon in the photochemical model. For simplicity, only two-body rate coefficients are presented in this flowchart. The same Arrhenius coefficients are used after each temperature profile modification.
Current usage metrics show cumulative count of Article Views (full-text article views including HTML views, PDF and ePub downloads, according to the available data) and Abstracts Views on Vision4Press platform.
Data correspond to usage on the plateform after 2015. The current usage metrics is available 48-96 hours after online publication and is updated daily on week days.
Initial download of the metrics may take a while.