Fig. 9
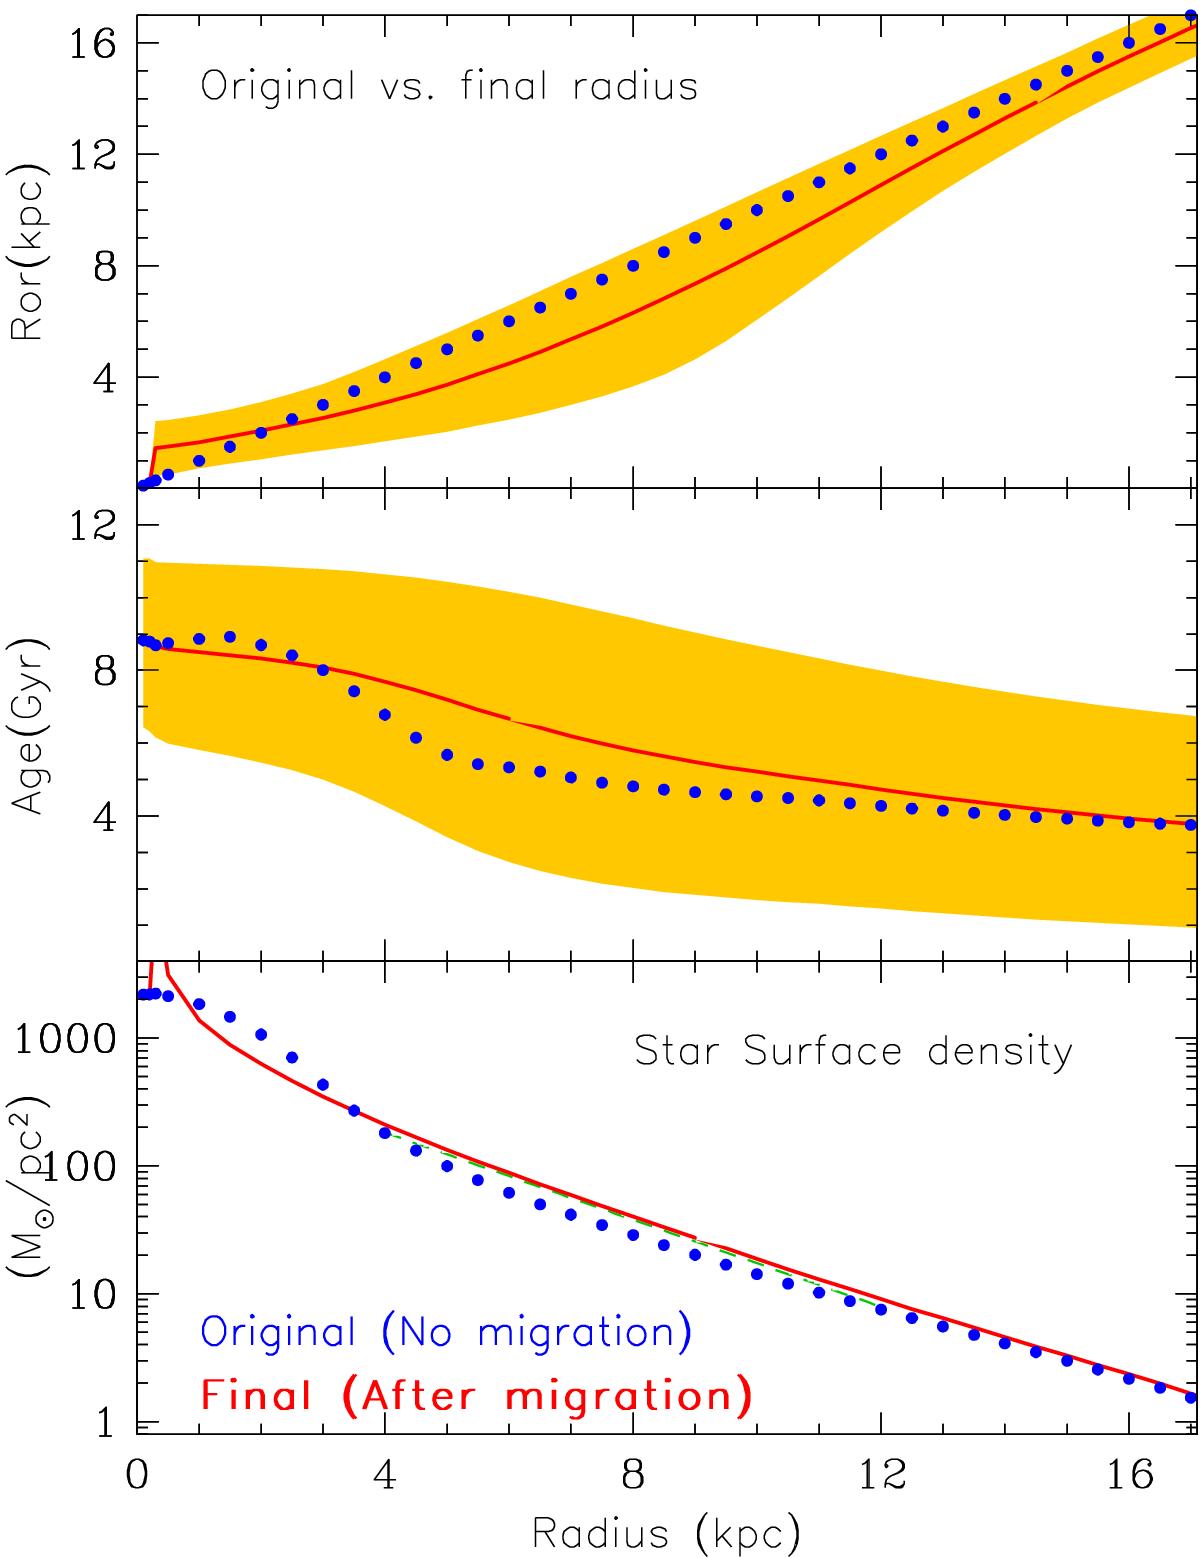
Average radius of origin of stars (top), average stellar age (middle) and star surface density profile (bottom), as a function of galactocentric radius. In all panels, the continuous (red) curve corresponds to the results of the model with radial migration (churning+blurring), while the dotted (blue) curve shows the results with no radial migration. In the top and middle panels, the shaded area contains the ±1σ values – containing ±34% of the stars – around the average. In the bottom panel, a best fit exponential with scalelength rd = 2 of the exponentially decreasing outwards. 25 kpc in the 3 to 13 kpc region and with Σ(r = 8 kpc) = 38 M⊙/pc2 is also displayed (green dashed line).
Current usage metrics show cumulative count of Article Views (full-text article views including HTML views, PDF and ePub downloads, according to the available data) and Abstracts Views on Vision4Press platform.
Data correspond to usage on the plateform after 2015. The current usage metrics is available 48-96 hours after online publication and is updated daily on week days.
Initial download of the metrics may take a while.