Fig. 7
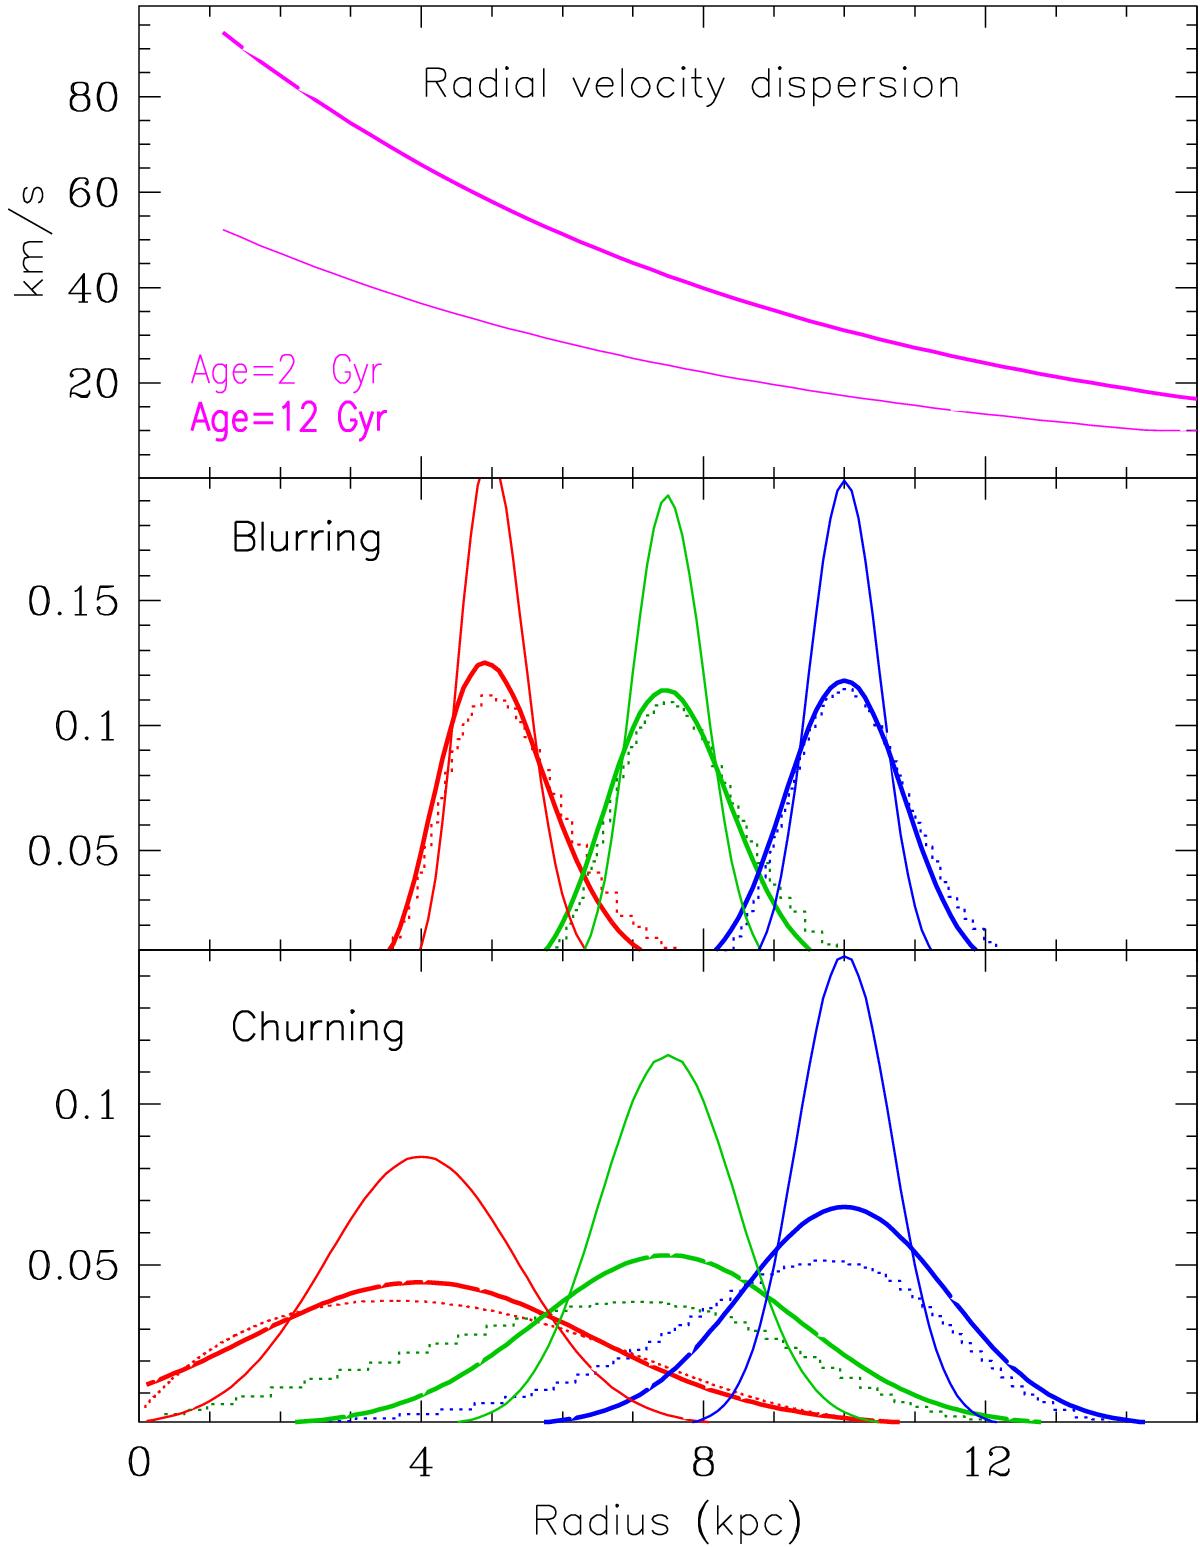
Top: model radial velocity dispersion at 2 Gyr (thin curve) and 12 Gyr (thick curve). Middle: probabilities of blurring. Bottom: probabilities of churning. In all panels our results (solid curves) are displayed for stars of home radius r = 5, 7.6 and 10 kpc, and for 2 Gyr (thin) and 12 Gyr (thick curves). The latter should be compared to the corresponding quantities reported in Schönrich & Binney (2009a) (dotted histograms).
Current usage metrics show cumulative count of Article Views (full-text article views including HTML views, PDF and ePub downloads, according to the available data) and Abstracts Views on Vision4Press platform.
Data correspond to usage on the plateform after 2015. The current usage metrics is available 48-96 hours after online publication and is updated daily on week days.
Initial download of the metrics may take a while.