Fig. 6
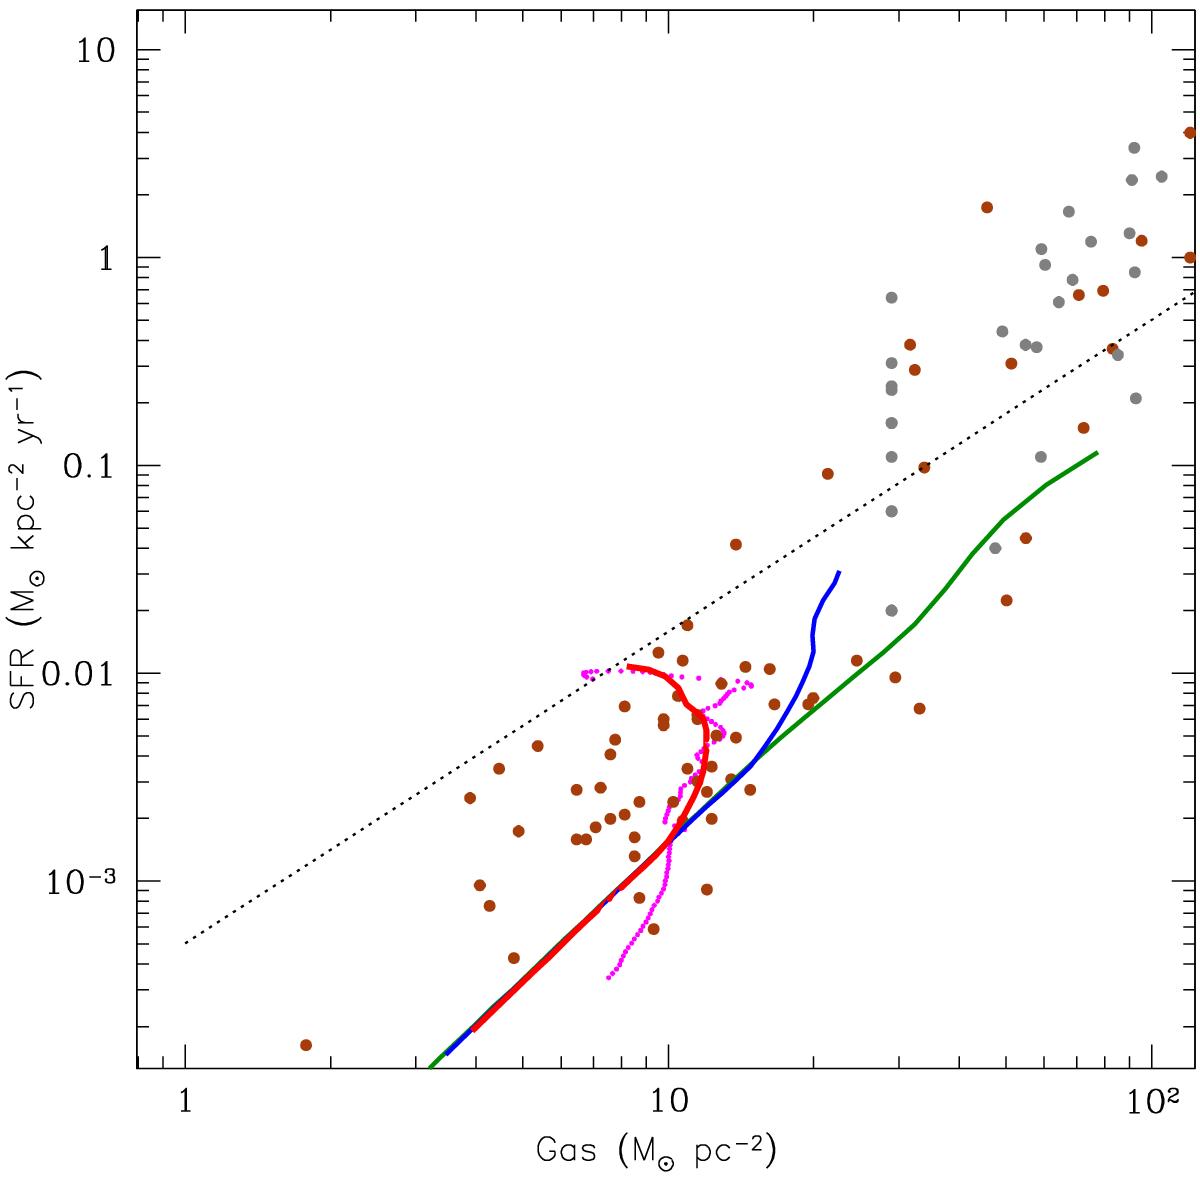
SFR vs. gas surface density. Model results are displayed for three different epochs, after 4 Gyr (green curve), 8 Gyr (blue) and 12 Gyr (red). The last is compared to the observationally inferred SFR profile of the Milky Way (dotted magenta curve), obtained as discussed in Appendix B. The data points concern extragalactic measurements, compiled by Krumholz et al. (2012) (see also Fig. B.2). The dotted line is ![]() .
.
Current usage metrics show cumulative count of Article Views (full-text article views including HTML views, PDF and ePub downloads, according to the available data) and Abstracts Views on Vision4Press platform.
Data correspond to usage on the plateform after 2015. The current usage metrics is available 48-96 hours after online publication and is updated daily on week days.
Initial download of the metrics may take a while.