Fig. 4
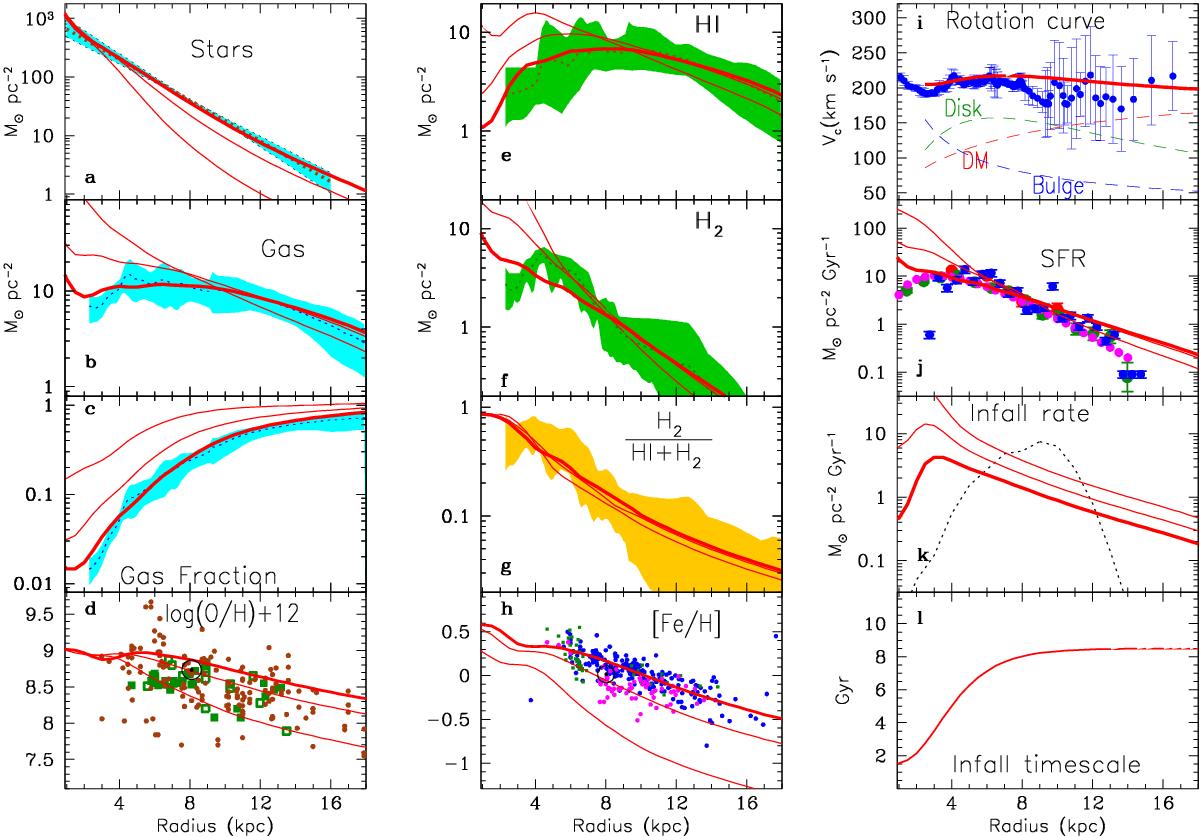
Model profiles (red solid curves) at 4, 8 Gyr (thin curves) and at 12 Gyr (thick curves) of various quantities and comparison of the latter with observational data concerning the present-day disk of the Milky Way. For all gaseous profiles (gas, HI, H2, gas fraction and molecular fraction), observational constraints are those discussed in Appendix A and presented in Fig. A.2. For stars, the shaded area is bounded by two exponential curves with scalelengths Rd = 2.1 and 2.7 kpc, respectively, which fix the range of plausible values for the stellar disk; they are normalised to a surface density of Σ∗(R = 8 kpc) = 38 ± 2 M⊙/pc2 in the solar neighbourhood. Data for the MW rotation curve are from Sofue (2012); the dashed curves represent the contributions of the bulge, disk and dark matter (blue, green and red, respectively ; see text for the bulge contribution). Data for the SFR profile are discussed in Appendix B and displayed in Fig. B.1. The observed present-day profile of infall rate (dotted curve) is based on estimates of Marasco et al. (2012) (see text). The bottom right panel displays the adopted timescales for exponential infall. Data for oxygen are from HI regions (Simpson et al. 1995; Afflerbach et al. 1997) and OB stars (Smartt & Rolleston 1997; Daflon & Cunha 2004) and for iron from Cepheids (Luck & Lambert 2011; Lemasle et al. 2013; Genovali et al. 2013).
Current usage metrics show cumulative count of Article Views (full-text article views including HTML views, PDF and ePub downloads, according to the available data) and Abstracts Views on Vision4Press platform.
Data correspond to usage on the plateform after 2015. The current usage metrics is available 48-96 hours after online publication and is updated daily on week days.
Initial download of the metrics may take a while.