Free Access
Fig. 3
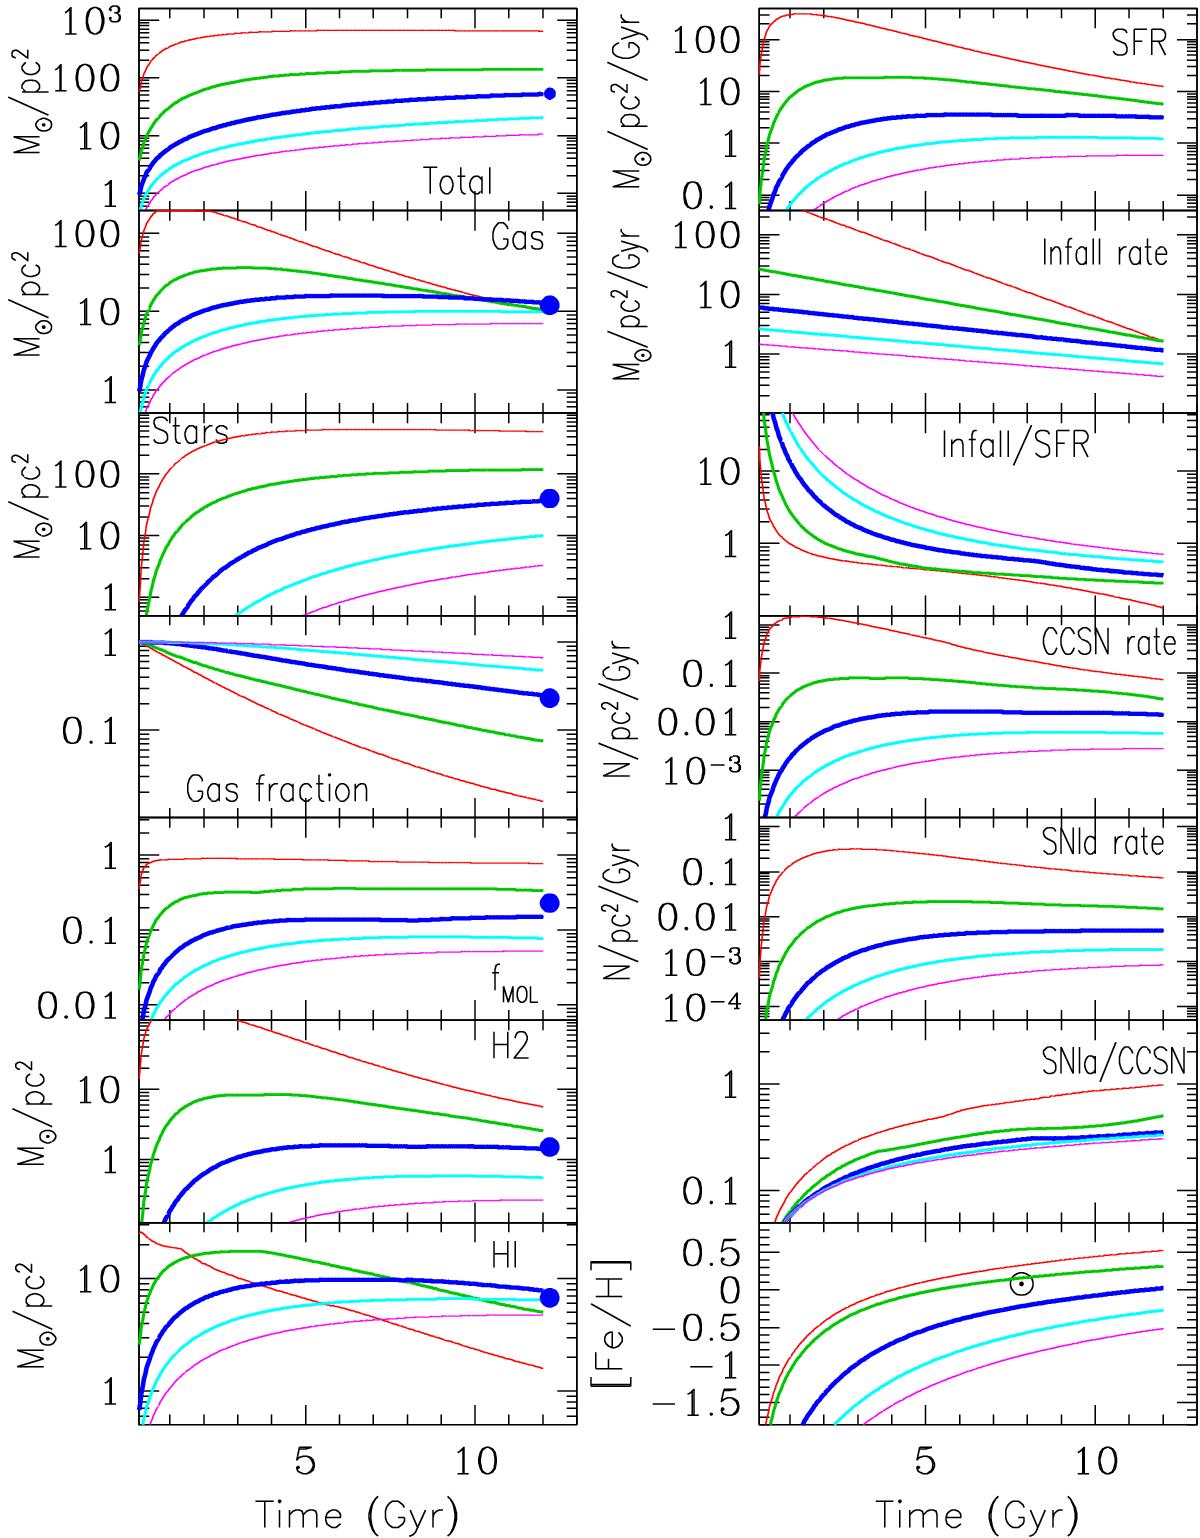
Evolution of various quantities in the baseline scenario as a function of time, for five different radial zones, at 2 (red), 5 (green), 8 (thick blue), 11 (cyan) and 14 (magenta) kpc. Observational data for local surface densities of gas and stars (from Table 1) are indicated with filled circles at T = 12 Gyr.
Current usage metrics show cumulative count of Article Views (full-text article views including HTML views, PDF and ePub downloads, according to the available data) and Abstracts Views on Vision4Press platform.
Data correspond to usage on the plateform after 2015. The current usage metrics is available 48-96 hours after online publication and is updated daily on week days.
Initial download of the metrics may take a while.