Fig. C.2
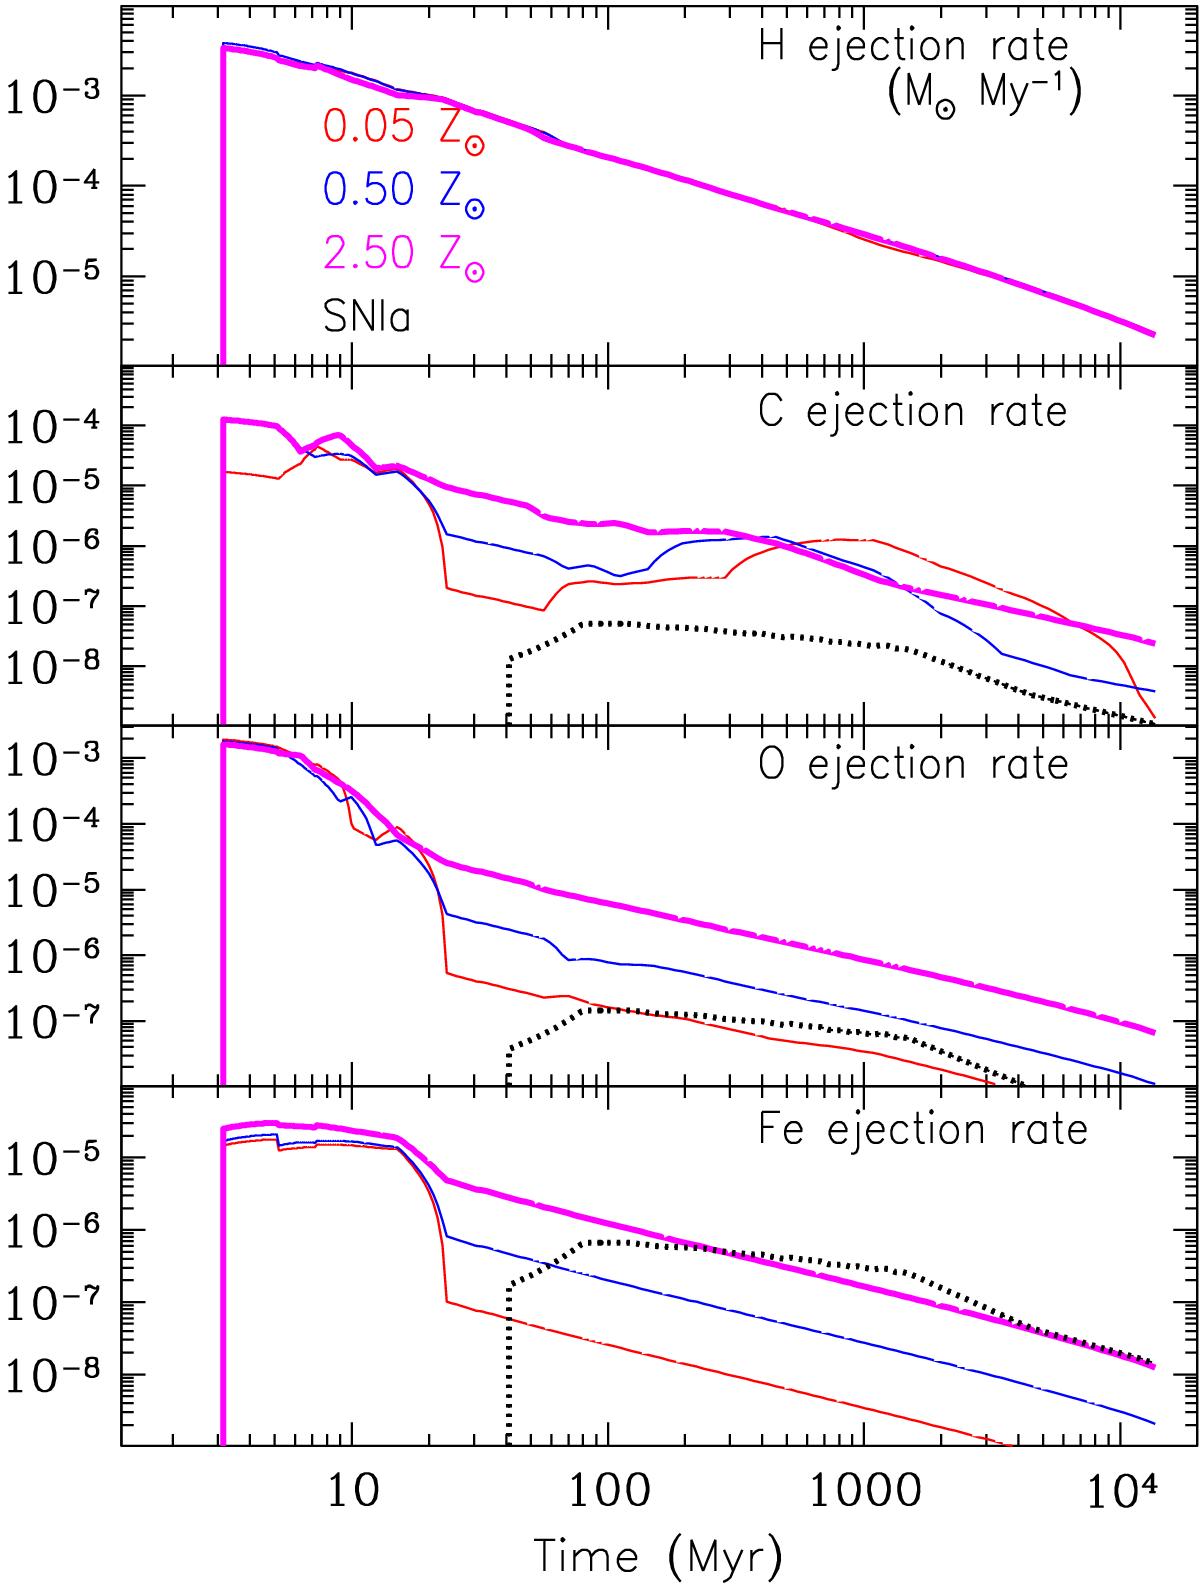
Ejection rates of hydrogen, carbon, oxygen and Fe from a stellar population of 1 M⊙ as a function of time. Yields are from Nomoto et al. (2013).The curves represent different metallicities, as indicated in the top panel. The dotted curves show the contribution of SNIa (resulting from a SSP of 1 M⊙) to the production of those elements.
Current usage metrics show cumulative count of Article Views (full-text article views including HTML views, PDF and ePub downloads, according to the available data) and Abstracts Views on Vision4Press platform.
Data correspond to usage on the plateform after 2015. The current usage metrics is available 48-96 hours after online publication and is updated daily on week days.
Initial download of the metrics may take a while.