Fig. C.1
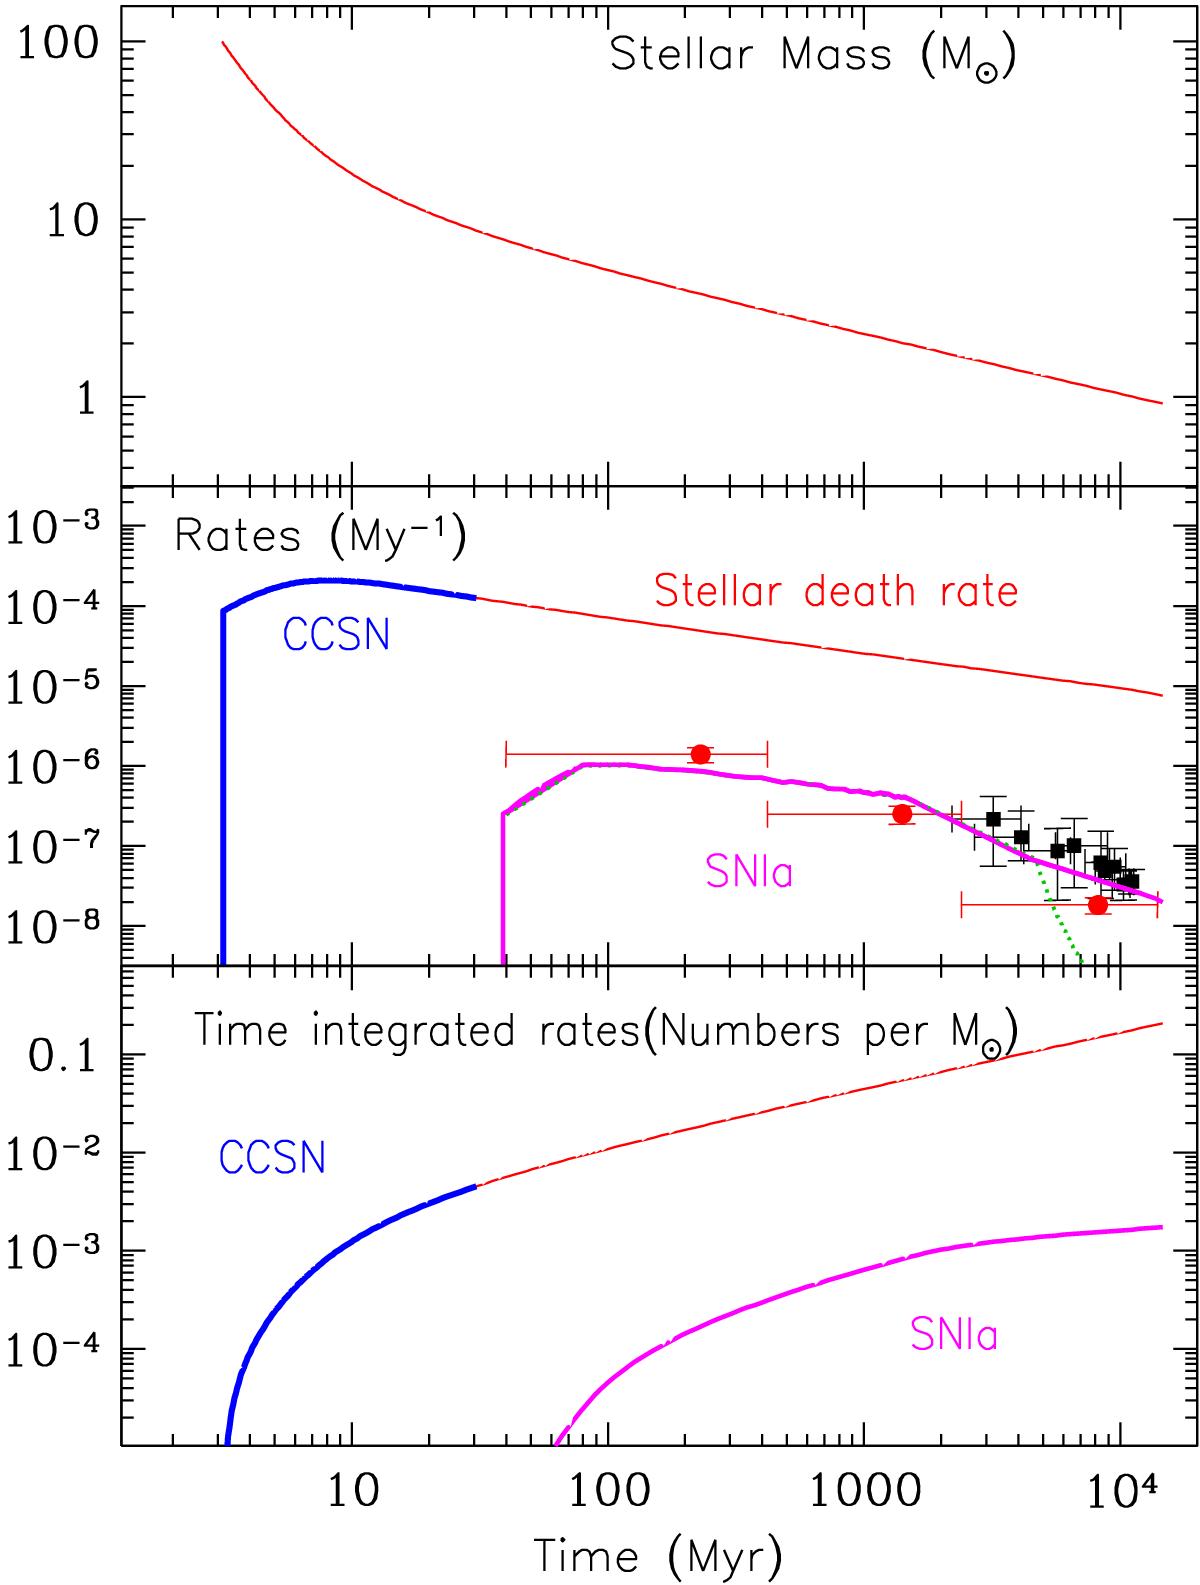
Top: stellar mass vs. lifetime. Middle: stellar death rate after an initial “burst” forming 1 M⊙ of stars: dN/ dt = dN/ dM × dM/ dt, where dN/ dM is the stellar IMF and dM/ dt the derivative of the curve in the top panel. The thick portion of the curve (up to ~35 My, corresponding to a star of 8 M⊙) is the rate of CCSN. The bottom right part of the middle panel displays the corresponding SNIa rate (the time delay distribution or TDD) adopted in this work (thick curve); it is a mixture of the Greggio (2005) formulation for the SD scenario up to 4.5 Gyr and an extrapolation ∝ t-1 after that time, in order to fit the data points from Maoz et al. (2012; filled circles) and from Maoz et al. (2010; squares). Bottom: time-integrated numbers of CCSN (thick portion of upper curve), single stars of mass M< 8M⊙ (thin portion of upper curve) and SNIa (lower curve), as a function of time, for an initial “burst” of 1 M⊙.
Current usage metrics show cumulative count of Article Views (full-text article views including HTML views, PDF and ePub downloads, according to the available data) and Abstracts Views on Vision4Press platform.
Data correspond to usage on the plateform after 2015. The current usage metrics is available 48-96 hours after online publication and is updated daily on week days.
Initial download of the metrics may take a while.