Fig. B.3
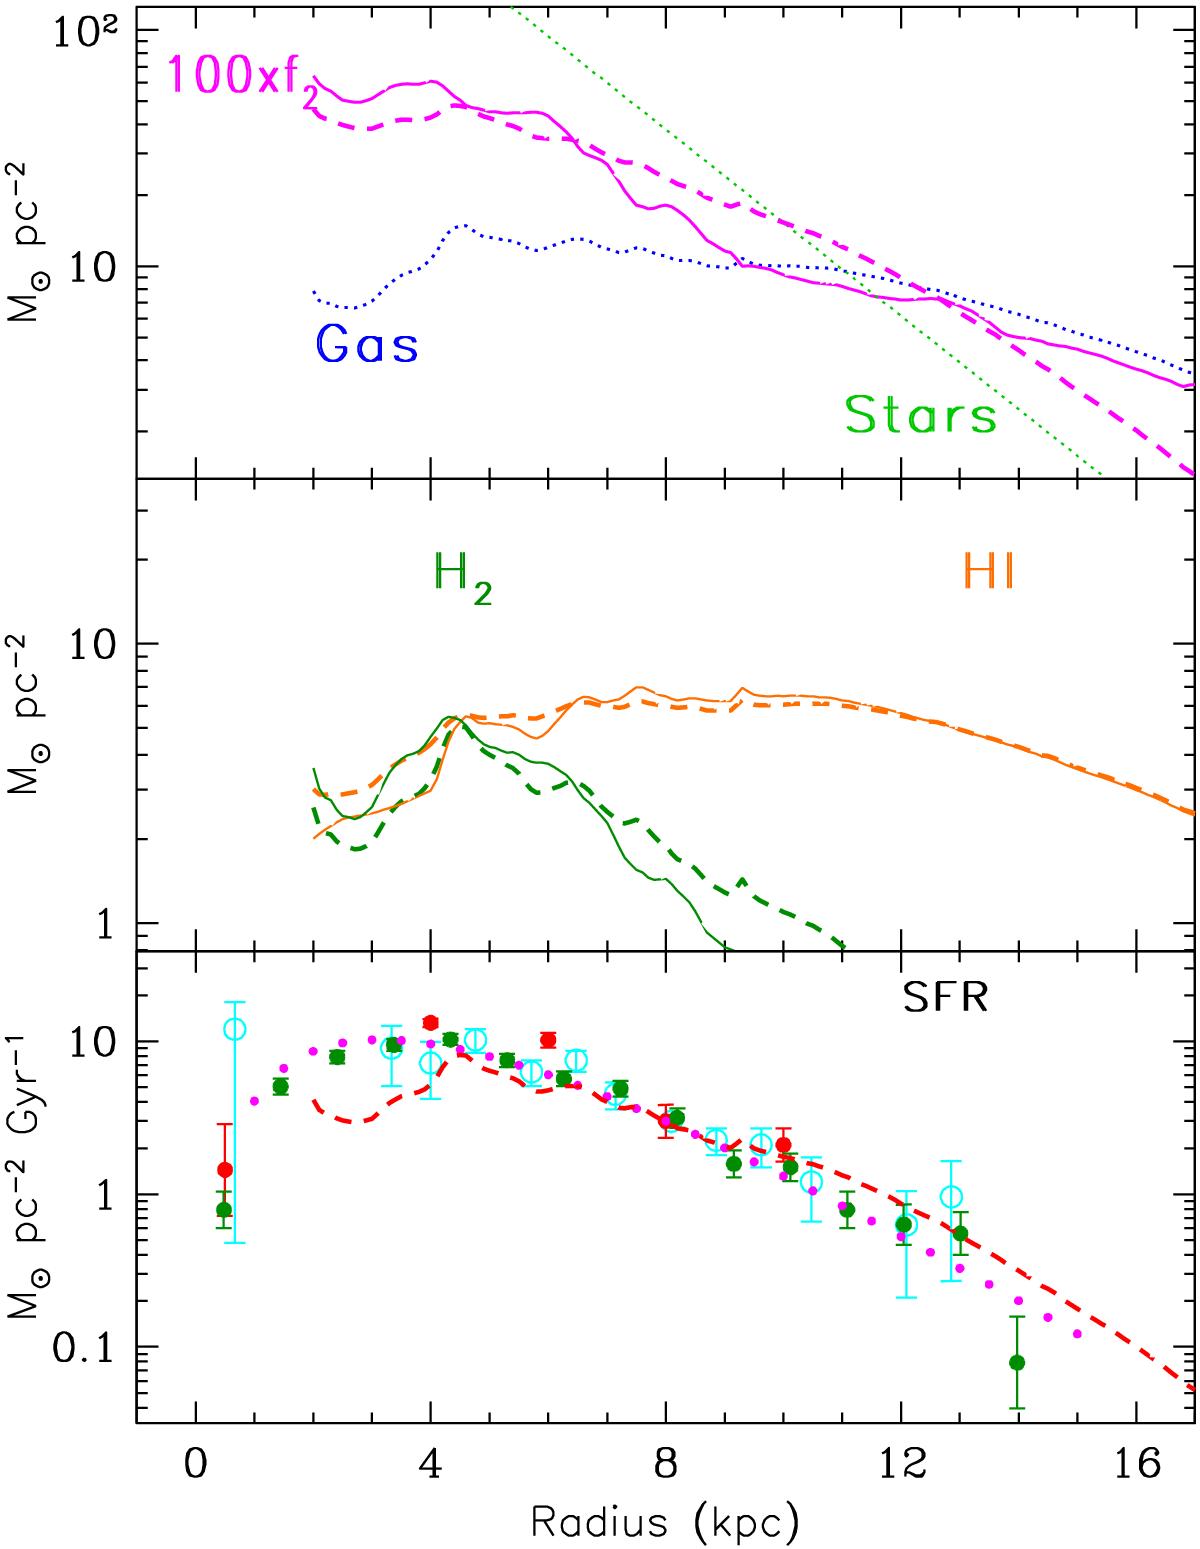
Top: observed molecular fraction ![]() (solid curve) and theoretical one (dashed), obtained with the prescription of Eq. (B.6) from the displayed gaseous and stellar profiles (dotted). Middle: observed (solid curves) vs. theoretical (dashed curves) profiles of HI and H2; the latter are obtained from the observed gas profile and the theoretically evaluated molecular fraction f2 (both in the top panel), as Σ(H2) = f2x ΣG/1.4 and Σ(HI) = (1 − f2)ΣG/1.4. Bottom: observed SFR profiles in the MW disk, vs. a theoretical SFR (dashed) curve), obtained from the theoretical profile of the molecular gas in the middle panel.
(solid curve) and theoretical one (dashed), obtained with the prescription of Eq. (B.6) from the displayed gaseous and stellar profiles (dotted). Middle: observed (solid curves) vs. theoretical (dashed curves) profiles of HI and H2; the latter are obtained from the observed gas profile and the theoretically evaluated molecular fraction f2 (both in the top panel), as Σ(H2) = f2x ΣG/1.4 and Σ(HI) = (1 − f2)ΣG/1.4. Bottom: observed SFR profiles in the MW disk, vs. a theoretical SFR (dashed) curve), obtained from the theoretical profile of the molecular gas in the middle panel.
Current usage metrics show cumulative count of Article Views (full-text article views including HTML views, PDF and ePub downloads, according to the available data) and Abstracts Views on Vision4Press platform.
Data correspond to usage on the plateform after 2015. The current usage metrics is available 48-96 hours after online publication and is updated daily on week days.
Initial download of the metrics may take a while.