Fig. B.2
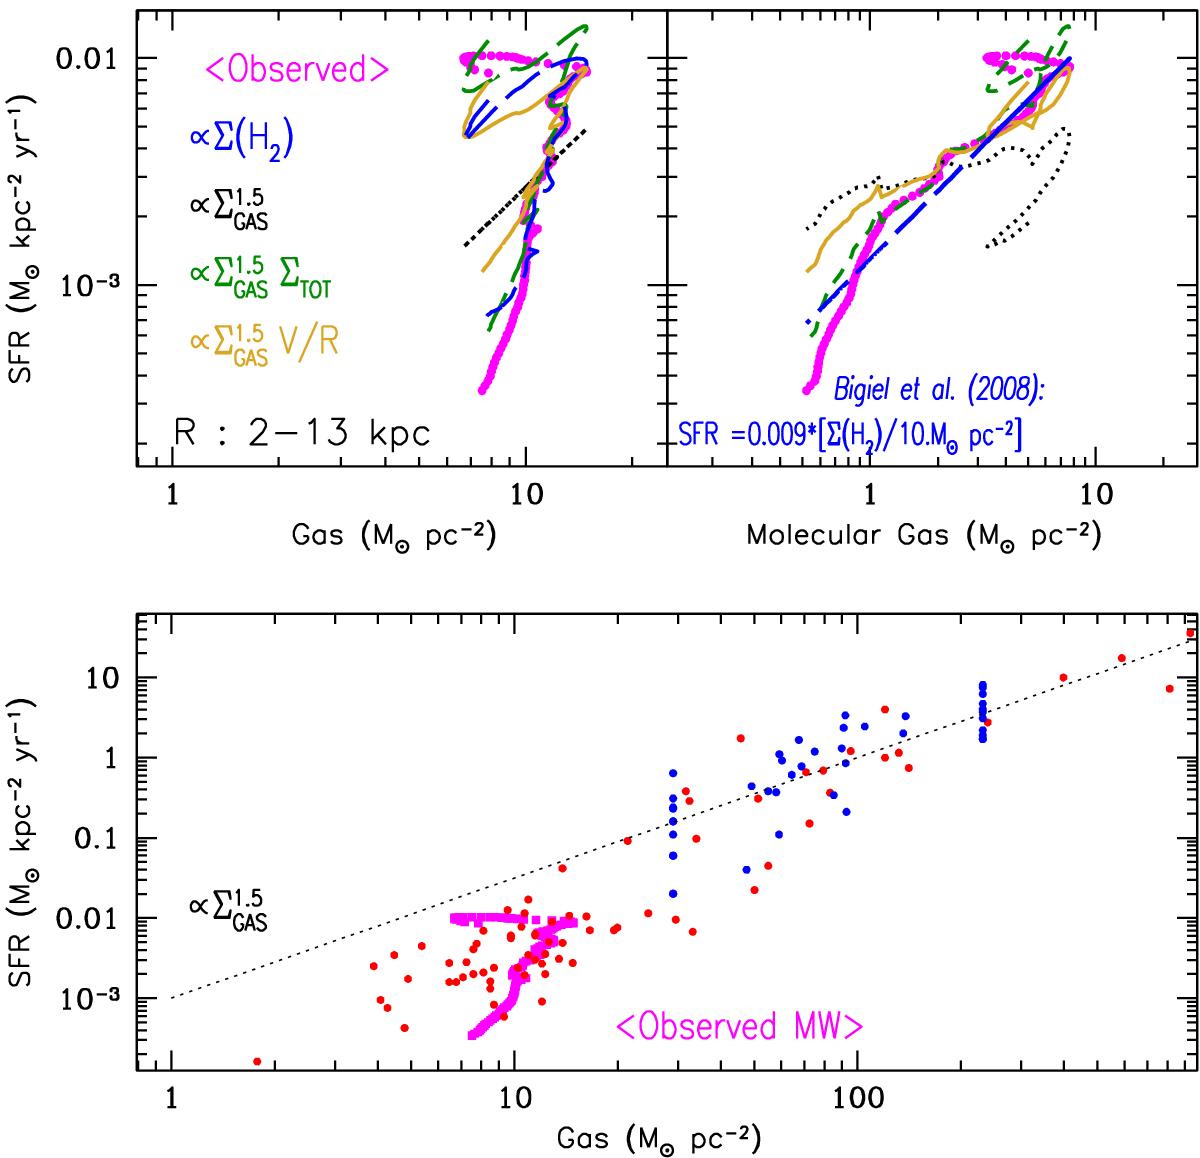
Top: SFR surface density vs. total gas surface density (left) and vs. H2 (right) for the MW disk, in the region between 2 and 13 kpc. In both panels, curves represent the same quantities as in Fig. B.1; the long dashed curve (SFR ∝ Σ(H2)) corresponds quantitatively to the fit of Bigiel et al. (2008) to extragalactic data and fits the adopted “observed” SFR profile in the MW disk quite well. Bottom: the “observed” SFR vs. gas relation in the MW is compared to a compilation of extragalactic data from Krumholz et al. (2012).
Current usage metrics show cumulative count of Article Views (full-text article views including HTML views, PDF and ePub downloads, according to the available data) and Abstracts Views on Vision4Press platform.
Data correspond to usage on the plateform after 2015. The current usage metrics is available 48-96 hours after online publication and is updated daily on week days.
Initial download of the metrics may take a while.