Fig. B.1
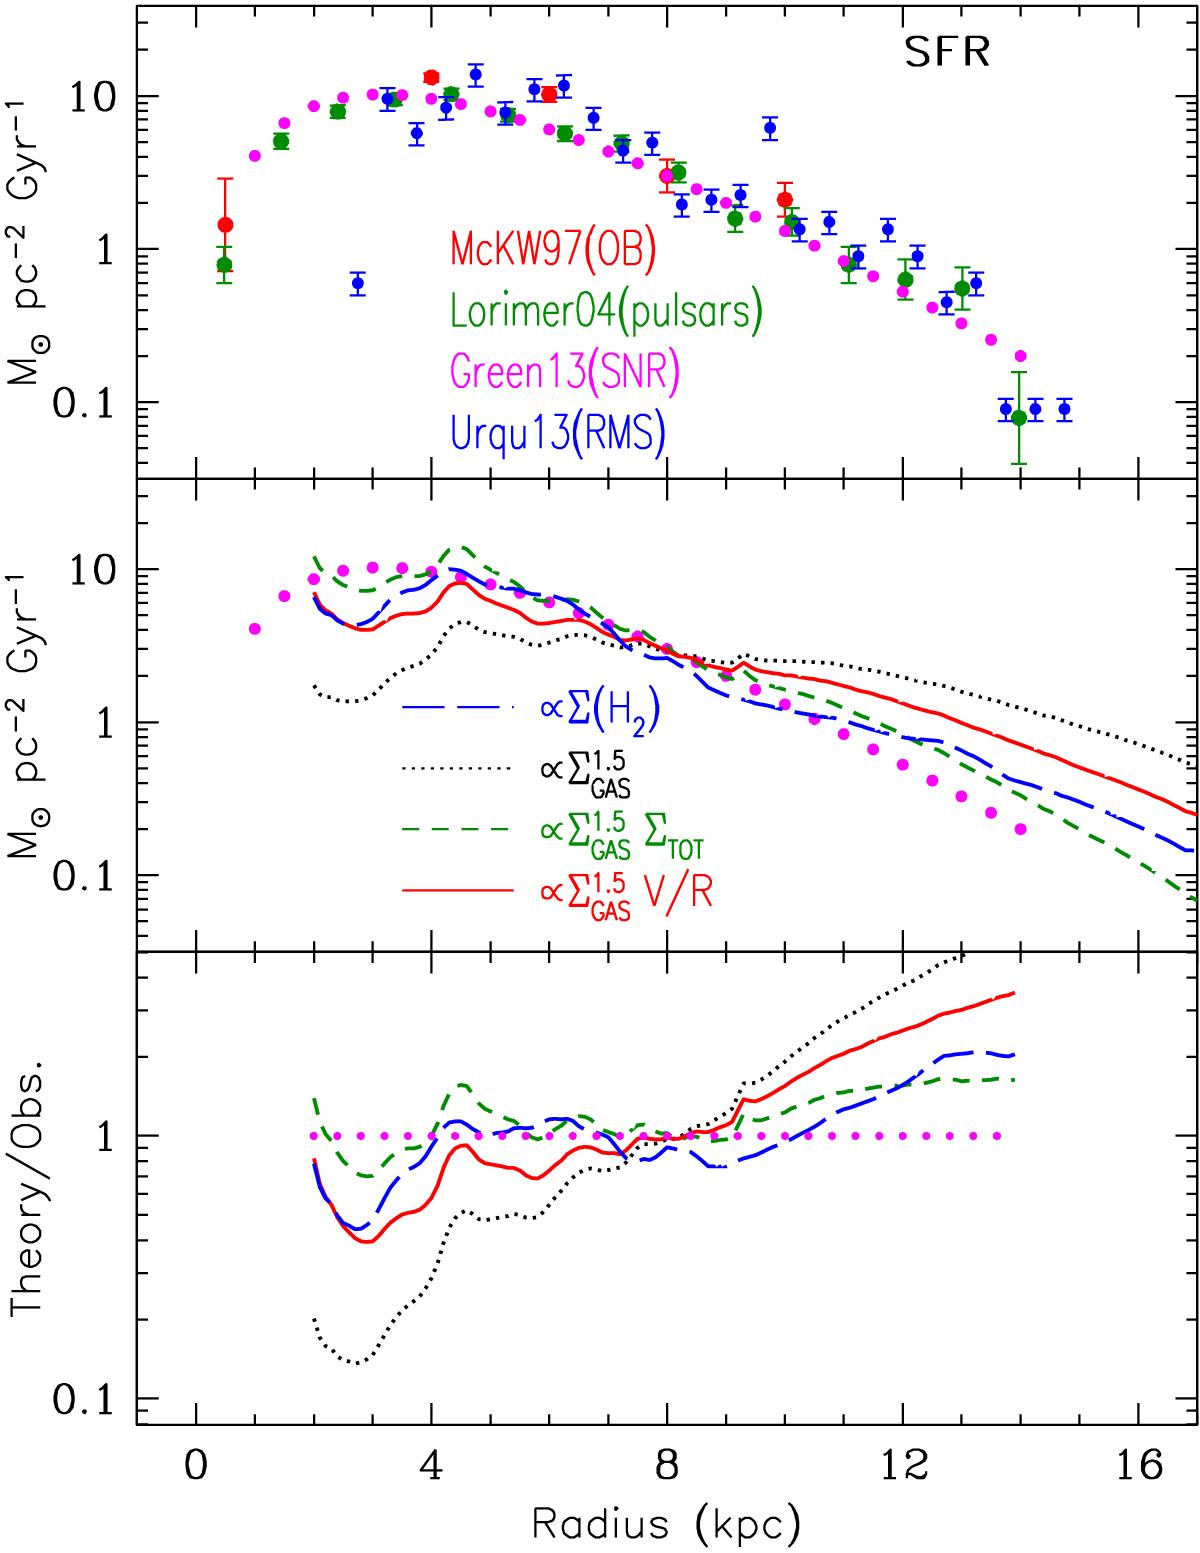
Top: observed surface density profiles of various SFR tracers (see text); the dotted curve – with no error bars – is the analytical form suggested by Green (2013) and it is here adopted as representative of the MW SFR profile. Middle: theoretical or empirical SF rates compared to the adopted profile of SFR tracers (the dotted curve from the upper panel); all profiles are normalised to the same value in R0 = 8 kpc. Bottom: ratio of the theoretical or empirical profiles to the adopted observed one.
Current usage metrics show cumulative count of Article Views (full-text article views including HTML views, PDF and ePub downloads, according to the available data) and Abstracts Views on Vision4Press platform.
Data correspond to usage on the plateform after 2015. The current usage metrics is available 48-96 hours after online publication and is updated daily on week days.
Initial download of the metrics may take a while.