Fig. 2
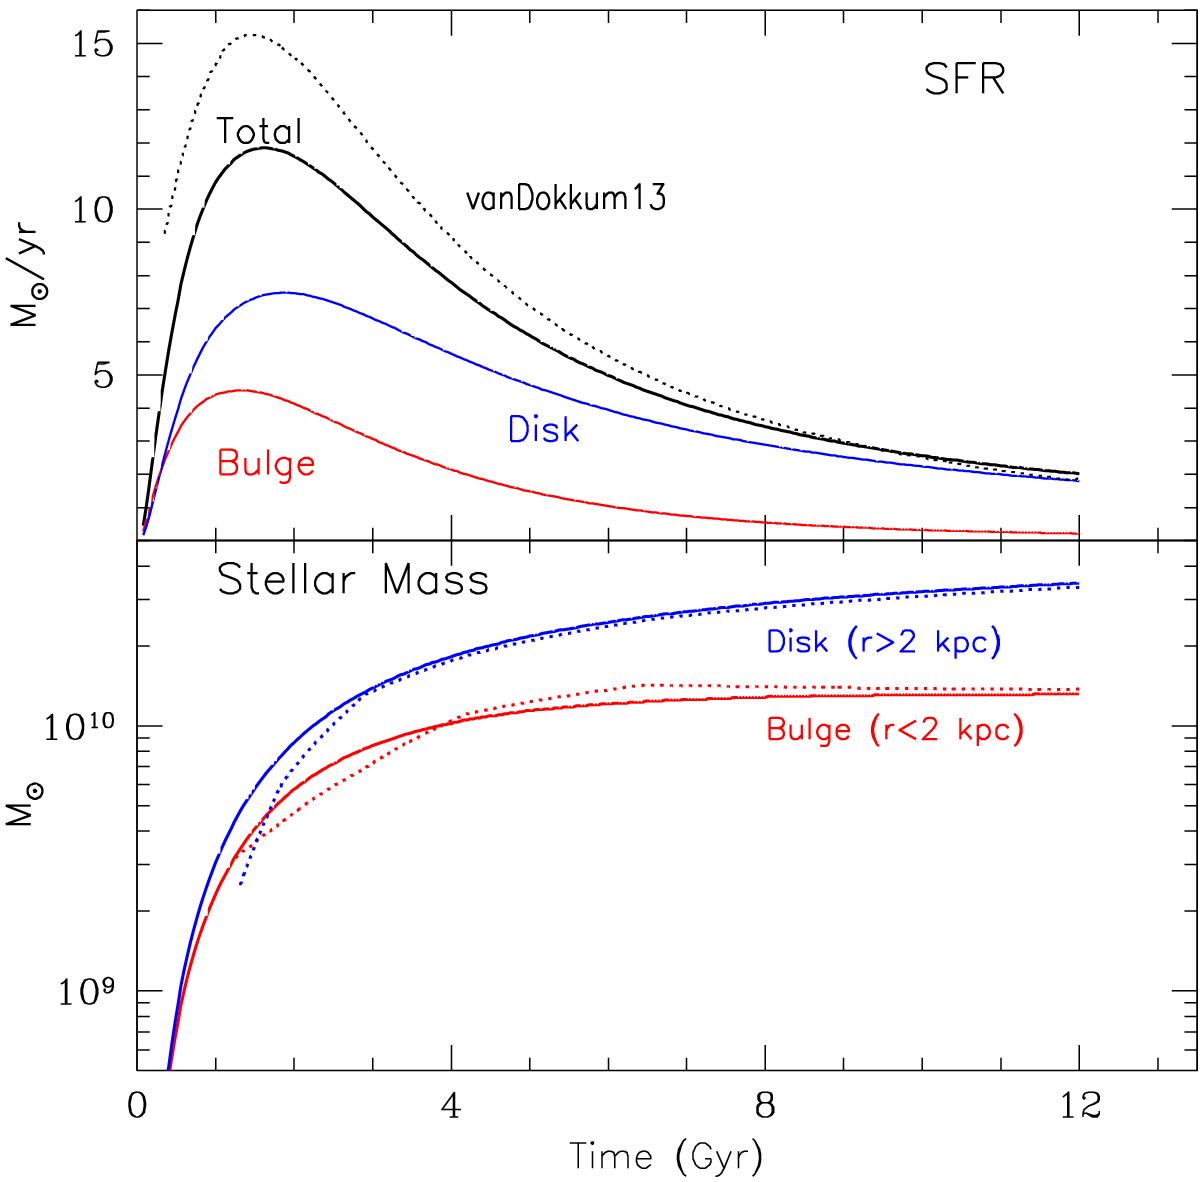
Comparison of the model results to the observed “stacked” evolution of disk galaxies of stellar mass 5 × 10¹⁰M⊙ (dotted curves) from van Dokkum et al. (2013). Top: evolution of the total SFR (black solid curve), decomposed into bulge and disk contributions. Bottom: evolution of the stellar mass of the bulge (r< 2 kpc) and of the disk (r> 2 kpc) of the model (solid red and blue curves, respectively).
Current usage metrics show cumulative count of Article Views (full-text article views including HTML views, PDF and ePub downloads, according to the available data) and Abstracts Views on Vision4Press platform.
Data correspond to usage on the plateform after 2015. The current usage metrics is available 48-96 hours after online publication and is updated daily on week days.
Initial download of the metrics may take a while.