Fig. A.1
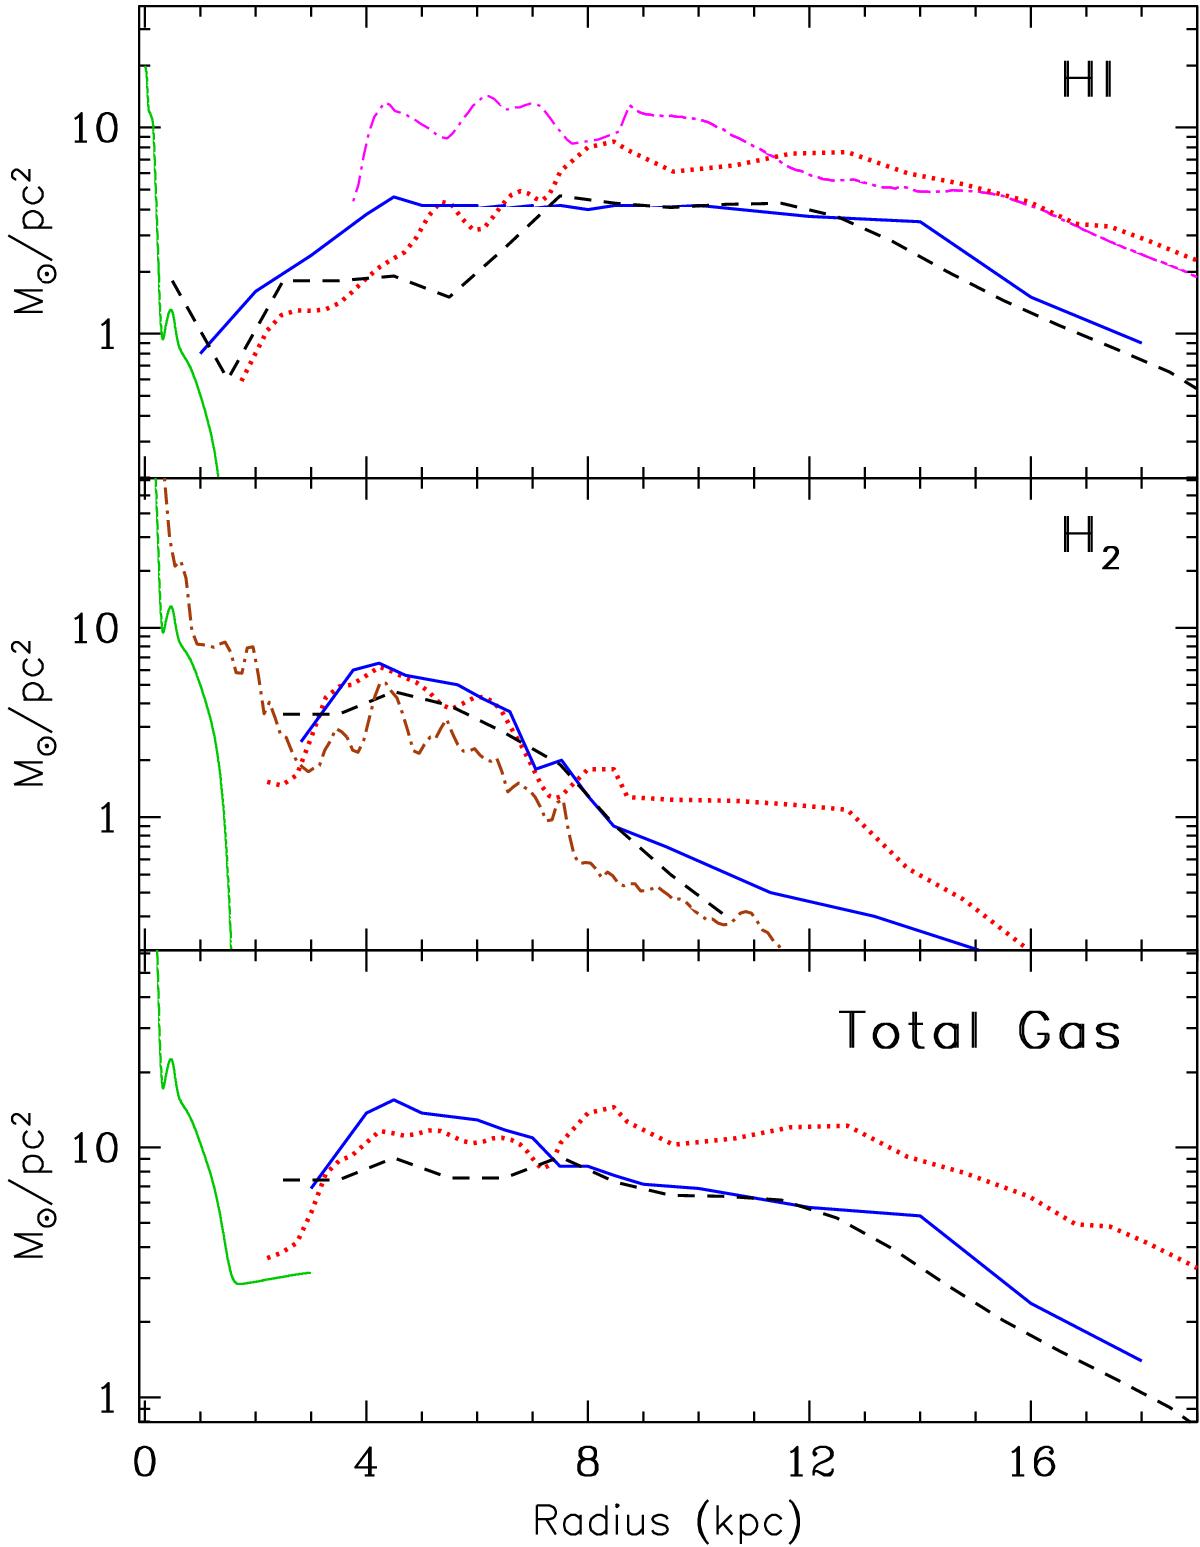
Surface density profiles of atomic hydrogen HI (top), molecular hydrogen H2 (middle) and total gas ΣG = 1.4 (HI+H2) (bottom). Disk data (beyond 2 kpc) are from: Dame (1993), solid; Olling & Merrifield (2001), dotted ; and Nakanishi & Sofue (2003, 2006), dashed. The dot-dashed curve in the HI panel corresponds to data from Kalberla & Dedes (2008) and in the H2 panel to data from Pohl et al. (2008). Bulge data (inner 2 kpc) in all panels are from Ferrière (2001).
Current usage metrics show cumulative count of Article Views (full-text article views including HTML views, PDF and ePub downloads, according to the available data) and Abstracts Views on Vision4Press platform.
Data correspond to usage on the plateform after 2015. The current usage metrics is available 48-96 hours after online publication and is updated daily on week days.
Initial download of the metrics may take a while.