Fig. 15
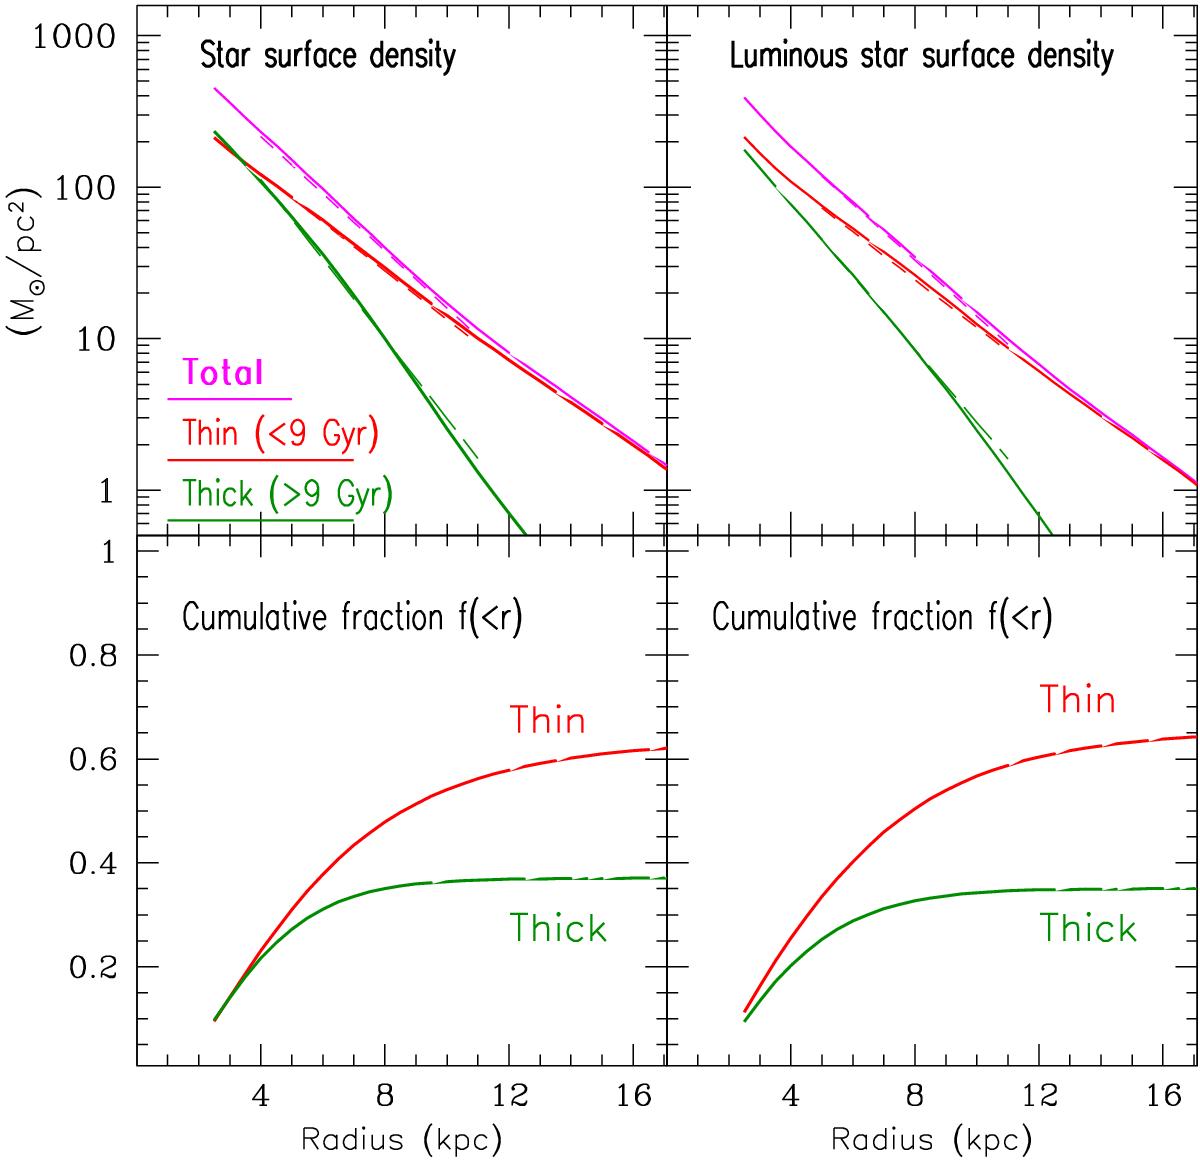
Thin vs. thick disk: left: stars plus stellar remnants; right: luminous stars only. Top: present-day stellar profiles: magenta: total; green: (thick disk); red: thin disk. In all curves, there is an attached best-fit exponential (dashed line of same colour) in the 5−11 kpc range, with scalelengths and column densities at R0 = 8 kpc as reported in Table 3. Bottom: cumulative fraction of the thin and thick disk masses with respect to the corresponding total disk mass Mdisk: Mthin( <r) /Mdisk (red curve) and Mthick( <r) /Mdisk (green curve) as a function of radius r.
Current usage metrics show cumulative count of Article Views (full-text article views including HTML views, PDF and ePub downloads, according to the available data) and Abstracts Views on Vision4Press platform.
Data correspond to usage on the plateform after 2015. The current usage metrics is available 48-96 hours after online publication and is updated daily on week days.
Initial download of the metrics may take a while.