Fig. 14
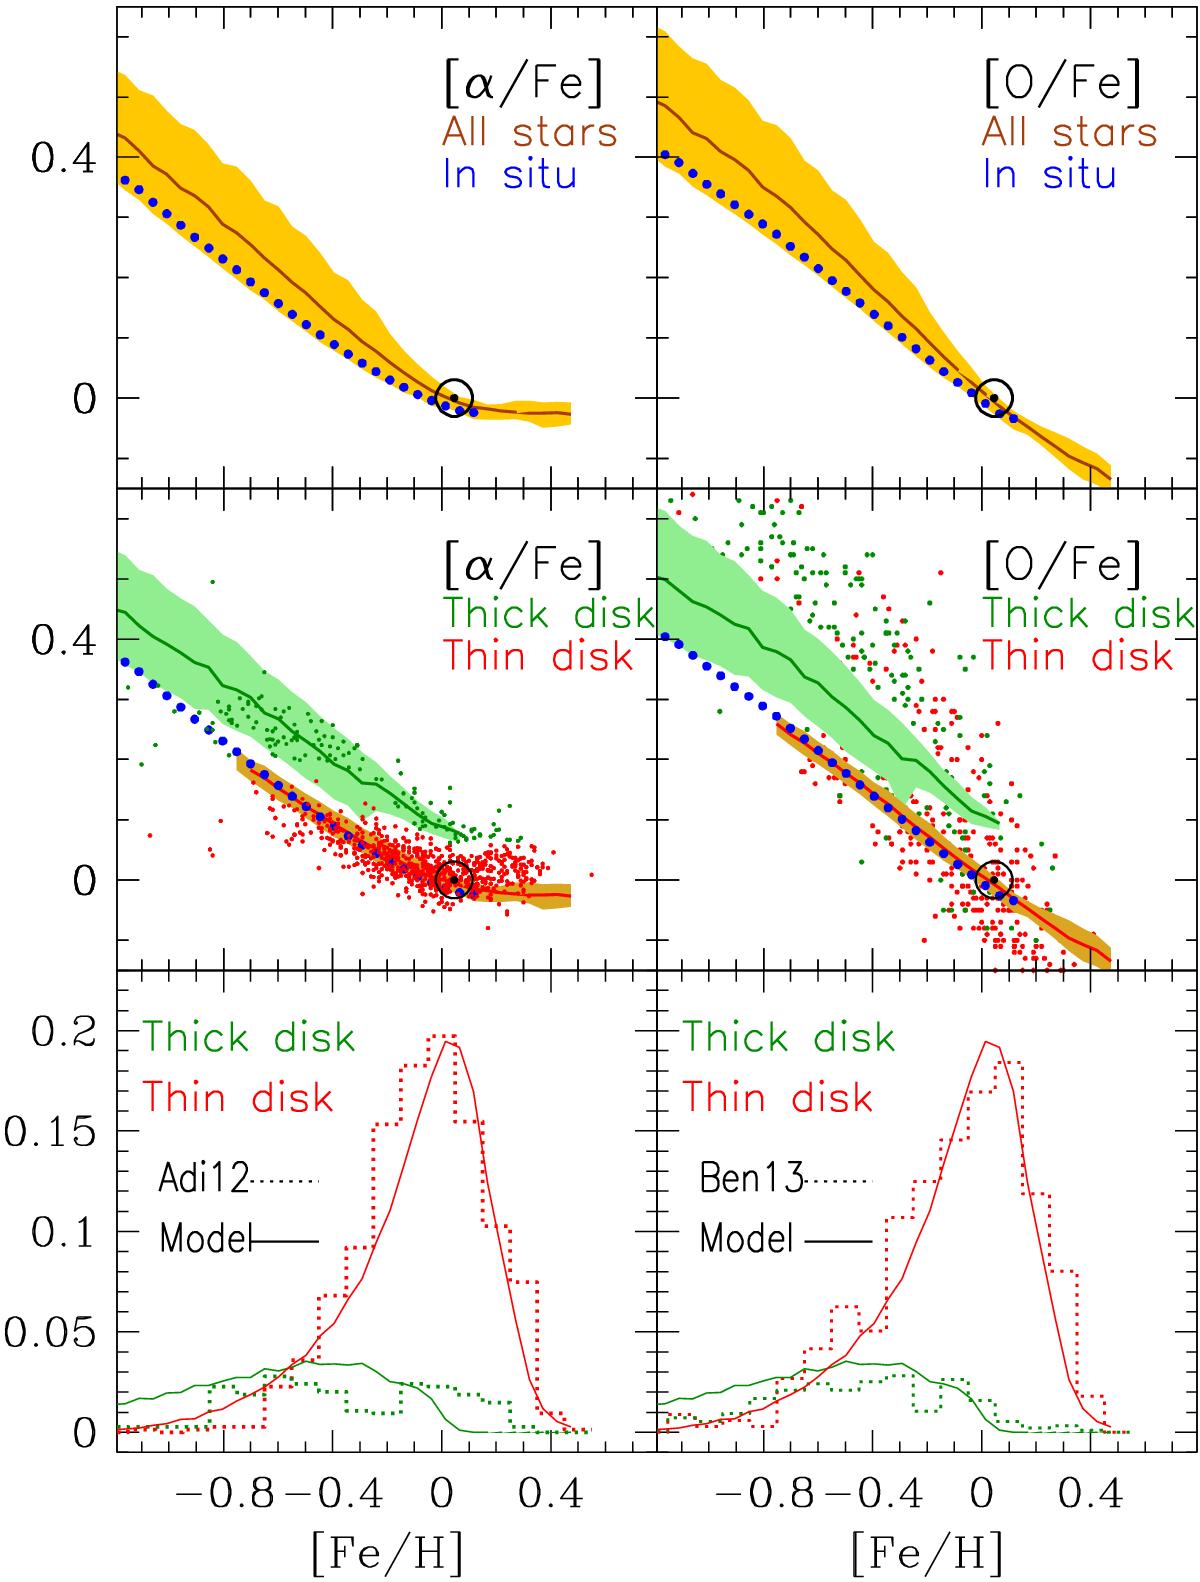
Solar annulus: top: [α/Fe] (left) and [O/Fe] (right) vs. metallicity, for all stars present today (solid brown curve) and for all stars born in situ (dotted blue curve). Middle: [α]/Fe (left) and [O/Fe] (right) vs. metallicity, for stars of the thick disk (>9 Gyr, green curve) and for stars of the thin disk (<9 Gyr, red curve). They are compared to corresponding data from Adibekyan et al. (2011; left) and from Bensby et al. (2014; right). In the top and middle panels the shaded areas enclose the ±1σ values around the corresponding model averages. The MD data for the thick disk of Bensby et al. (2014) are arbitrarily reduced by a factor of 3 (see text).
Current usage metrics show cumulative count of Article Views (full-text article views including HTML views, PDF and ePub downloads, according to the available data) and Abstracts Views on Vision4Press platform.
Data correspond to usage on the plateform after 2015. The current usage metrics is available 48-96 hours after online publication and is updated daily on week days.
Initial download of the metrics may take a while.