Fig. 12
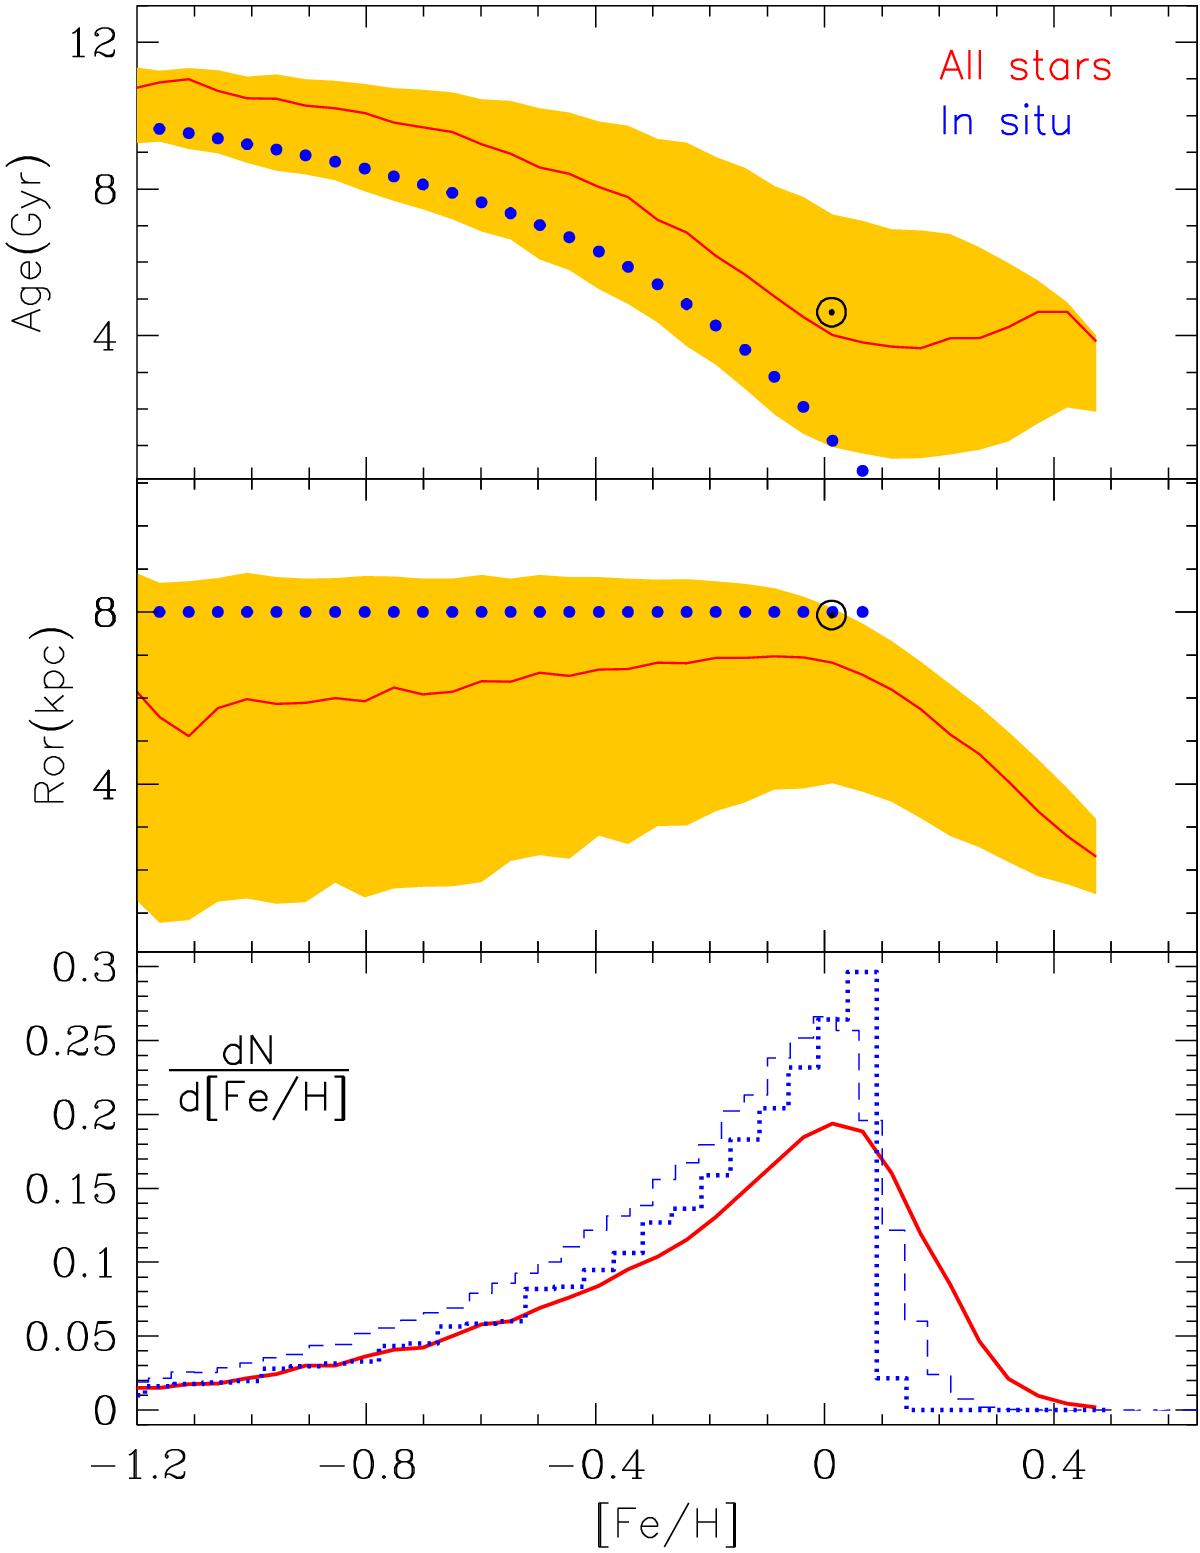
Solar neighbourhood: average age of stars (top), average birth radius (middle) and number distribution of stars (metallicity distribution, bottom) as function of their metallicity. In all panels, the dotted (blue) curves display the results for stars formed in situ and the solid (red) curves the results for the average values of all stars found at T = 12 Gyr in radius r = 8 ± 0.250 kpc. The shaded areas in the top and middle panels enclose ±1σ values around the corresponding averages. The dashed histogram in the lower panel is calculated with the effect of epicycles only.
Current usage metrics show cumulative count of Article Views (full-text article views including HTML views, PDF and ePub downloads, according to the available data) and Abstracts Views on Vision4Press platform.
Data correspond to usage on the plateform after 2015. The current usage metrics is available 48-96 hours after online publication and is updated daily on week days.
Initial download of the metrics may take a while.