Fig. 11
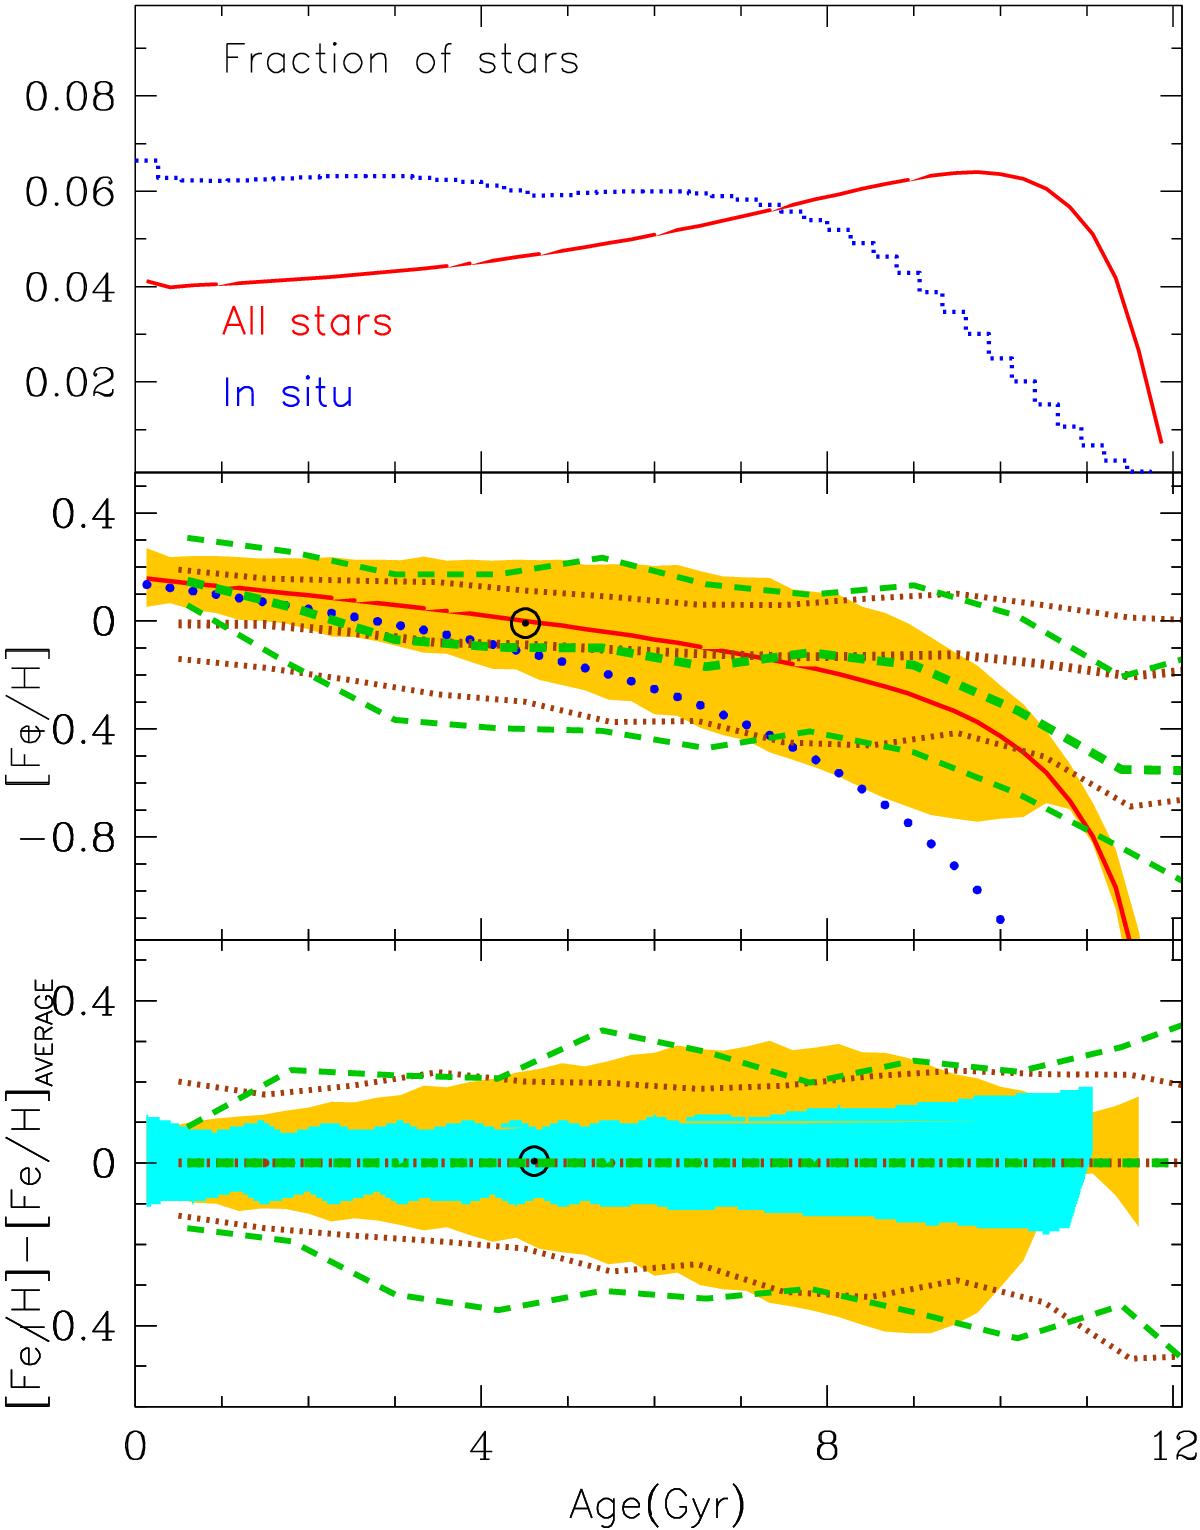
Solar annulus: top: fraction of all stars ever born in situ in the solar annnulus (blue dotted) and fraction of all stars found in the solar annulus at T = 12 Gyr (red solid) as a function of stellar age. Average [Fe/H] of stars (middle) and 1σ dispersion around the average (bottom) as function of stellar age, compared to observations. The solid (red) curve in the middle panel displays the results for all stars found at T = 12 Gyr in radius r = 8 ± 0.25 kpc. In both panels, the shaded (yellow) areas represent the ±1σ limits of the model; the brown (dotted) and green (dashed) curves represent the corresponding averages and ±1σ limits of the observations of Casagrande et al. (2011) and Bensby et al. (2014), respectively. The narrower blue shaded areain the bottom panel shows the results of a calculation with blurring alone.
Current usage metrics show cumulative count of Article Views (full-text article views including HTML views, PDF and ePub downloads, according to the available data) and Abstracts Views on Vision4Press platform.
Data correspond to usage on the plateform after 2015. The current usage metrics is available 48-96 hours after online publication and is updated daily on week days.
Initial download of the metrics may take a while.