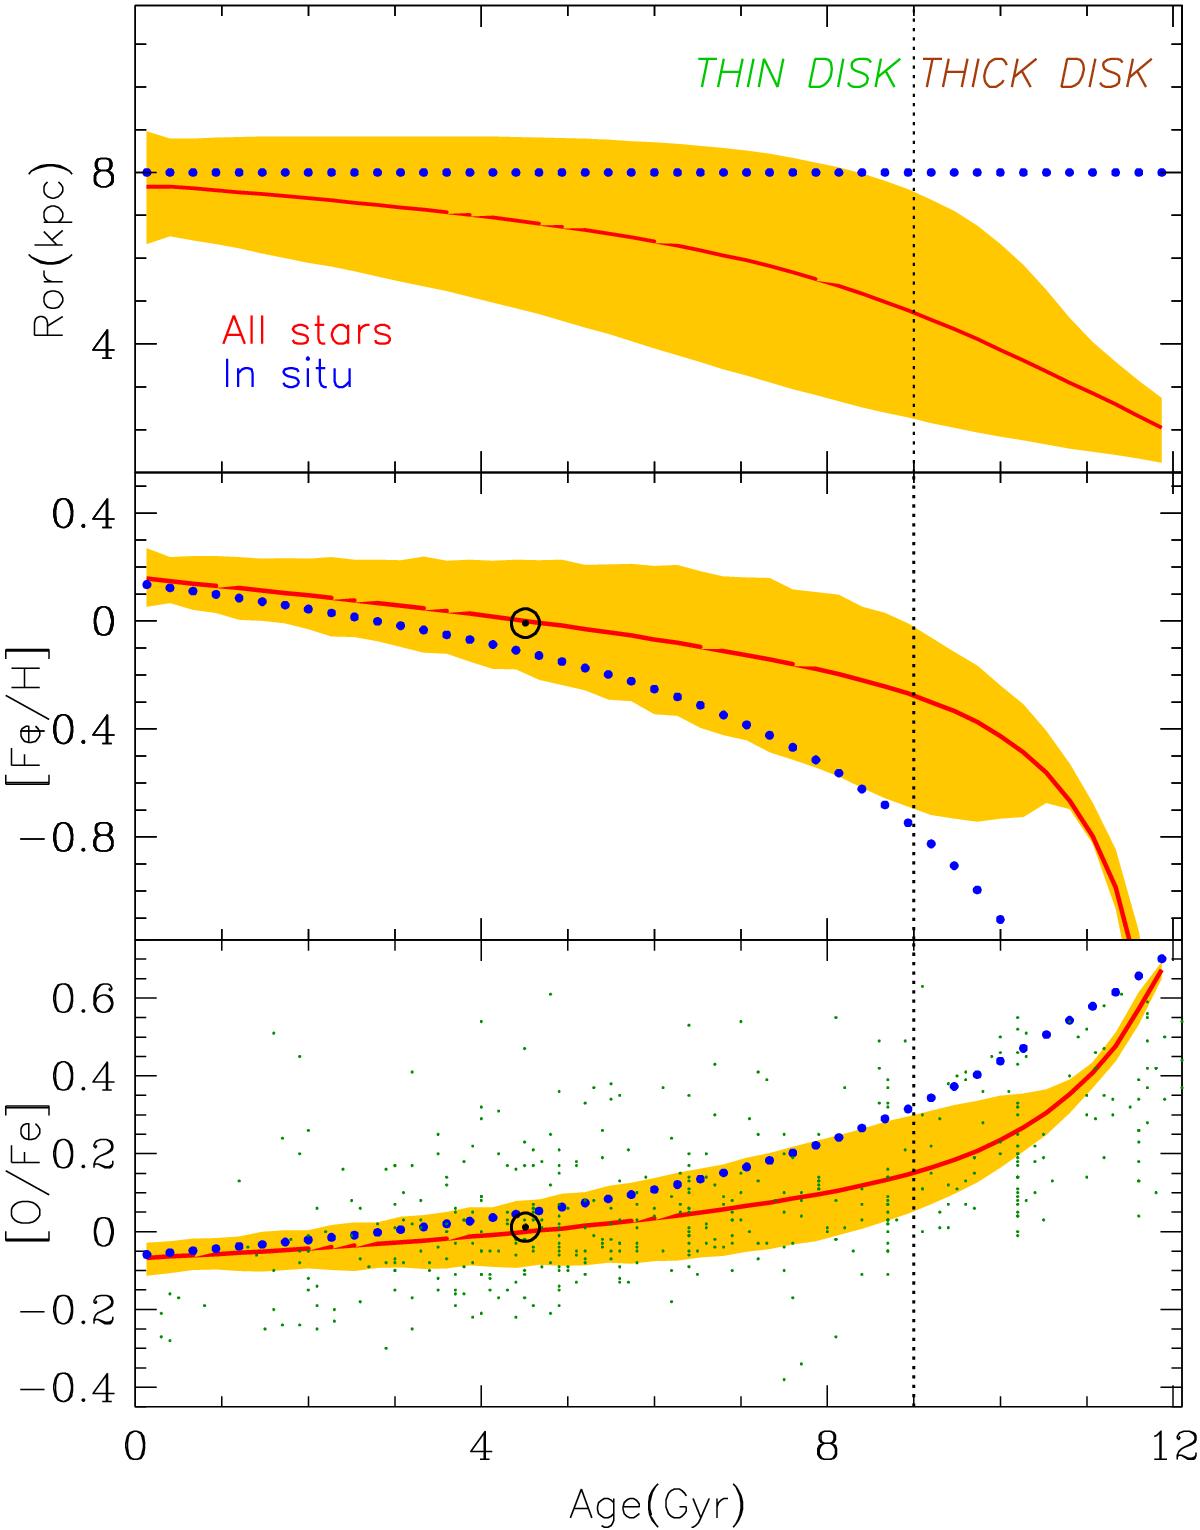
Fig. 10

Solar neighbourhood: average birth radius (top), average [Fe/H] (middle) and average [O/Fe] of stars (bottom) as function of their age. In all panels, the dotted (blue) curves display the results for stars formed in situ and the solid (red) curves the results for all stars found at T = 12 Gyr in radius r = 8 ± 0.25 kpc. The shaded areas in all panels enclose ±1σ values around the corresponding averages. Data points are from the survey of Bensby et al. (2014). The dotted vertical line at 9 Gyr separates the thin from thick disk stars, according to the assumption made here (see Sect. 4.1). The symbol ⊙ denotes the position of the Sun in the corresponding panel, as well as in Figs. 11−13.
Current usage metrics show cumulative count of Article Views (full-text article views including HTML views, PDF and ePub downloads, according to the available data) and Abstracts Views on Vision4Press platform.
Data correspond to usage on the plateform after 2015. The current usage metrics is available 48-96 hours after online publication and is updated daily on week days.
Initial download of the metrics may take a while.


