Free Access
Fig. 1
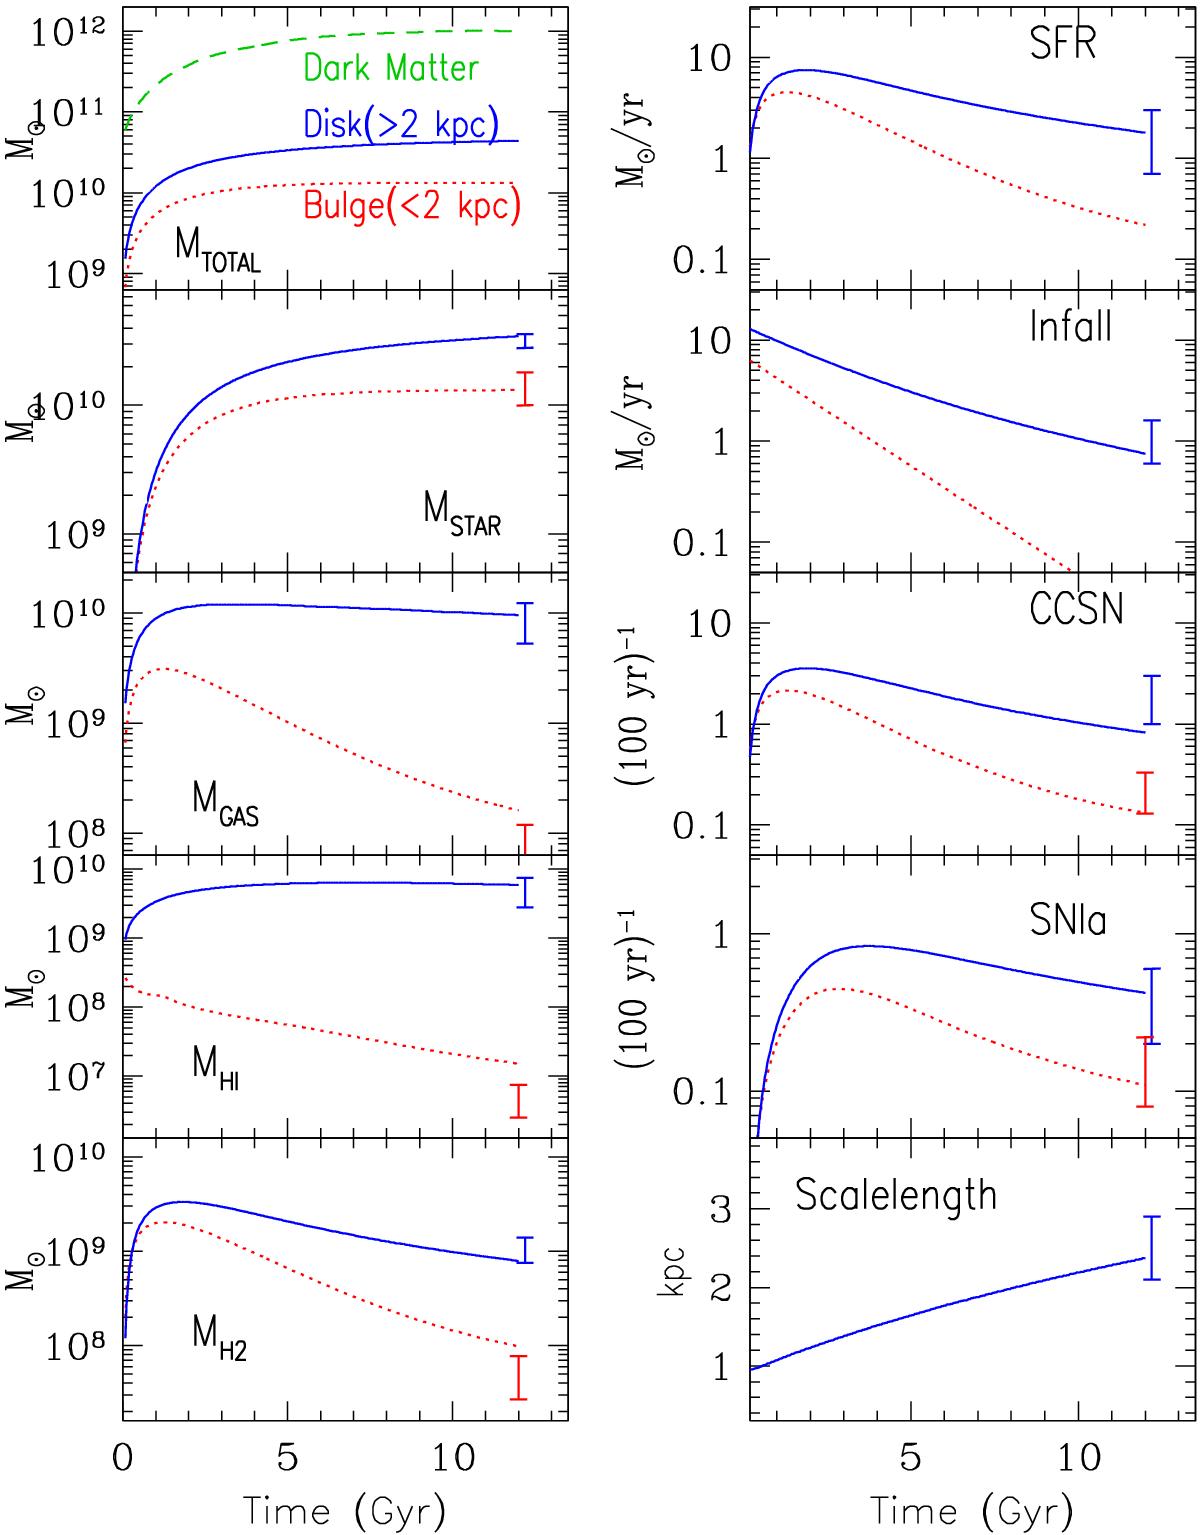
Evolution of various quantities in the baseline scenario. In all panels, solid bluecurves correspond to the evolution of the disk (r> 2 kpc) and dotted redones to that of the bulge (r< 2 kpc), respectively. Vertical bars at 12 Gyr represent observational constraints (see text and Table 1).
Current usage metrics show cumulative count of Article Views (full-text article views including HTML views, PDF and ePub downloads, according to the available data) and Abstracts Views on Vision4Press platform.
Data correspond to usage on the plateform after 2015. The current usage metrics is available 48-96 hours after online publication and is updated daily on week days.
Initial download of the metrics may take a while.