| Issue |
A&A
Volume 579, July 2015
|
|
|---|---|---|
| Article Number | A129 | |
| Number of page(s) | 6 | |
| Section | Catalogs and data | |
| DOI | https://doi.org/10.1051/0004-6361/201526525 | |
| Published online | 16 July 2015 | |
A Lucky Imaging search for stellar sources near 74 transit hosts⋆
Max-Planck-Institut für Astronomie,
Königstuhl 17,
69117
Heidelberg,
Germany
e-mail:
This email address is being protected from spambots. You need JavaScript enabled to view it.
Received: 13 May 2015
Accepted: 17 June 2015
Abstract
Context. Many transiting-planet host stars lack high-resolution imaging so that close stellar sources can be missed. Those unknown stars potentially bias the derivation of the planetary and stellar parameters from the transit light curve, regardless of whether they are bound or not. In addition, bound stellar companions interact gravitationally with the exoplanet host star, the disk, and the planets and can thus influence the formation and evolution of the planetary system strongly.
Aims. We extended our high-resolution Lucky Imaging survey for close stellar sources by 74 transiting-planet host stars. Thirty-nine of these stars lack previous high-resolution imaging, 23 are follow up observations of companions or companion candidates, and the remaining stars have been observed by others with AO imaging but in different bands. We determine the separation of all new and known companion candidates and estimate the flux ratio in the observed bands.
Methods. All observations were carried out with the Lucky Imaging camera AstraLux Norte at the Calar Alto 2.2 m telescope in i′ and z′ passbands.
Results. We find new stellar sources within 1′′ of HAT-P-27, HAT-P-28, HAT-P-35, WASP-76, and WASP-103 and between 1′′ and 4″ of HAT-P-29 and WASP-56.
Key words: techniques: high angular resolution / binaries: visual / planetary systems
Based on observations collected at the German-Spanish Astronomical Center, Calar Alto, jointly operated by the Max-Planck-Institut für Astronomie Heidelberg and the Instituto de Astrofísica de Andalucía (CSIC).
© ESO, 2015
1. Introduction
During the past 15 years, more than 1000 confirmed and several 1000 candidate exoplanets have been found by ground- and space-based transit searches, such as HATNet (Bakos et al. 2004), SuperWasp (Pollacco et al. 2006), CoRoT (Baglin et al. 2006), and Kepler (Borucki et al. 2010; Batalha et al. 2013; Burke et al. 2014). Transiting exoplanets (TEPs) offer the unique opportunity to determine a variety of planetary properties, such as true mass, mean density, and surface gravity. They also allow the planet’s atmosphere to be characterized through spectroscopy, the planet’s temperature to be determined in secondary eclipse observations, and the angle to be measured between the orbital plane and the stellar rotation axis via the Rossiter-McLaughlin effect (Winn et al. 2005).
Since many follow-up observations of transiting planets were limited in angular resolution either by the instrument (e.g., Spitzer/IRAC) or – in the case of ground-based follow-up – seeing limitations, care has to be taken not to miss a blended close star. This is especially true for faint sources because bright stars may be recognized in follow-up spectra. Unknown, close stars add a constant flux to the light curve which bias both primary and secondary eclipse measurements. In the first case, the additional source leads to underestimating the planetary radius and consequently overestimating the planetary density. In the second case, the planet infrared emission spectrum can be underestimated by several tens of percentage points (e.g., Crossfield et al. 2012).
TEP hosts with detection, radial contrast limits, and references to other high-resolution imaging papers if available.
TEP hosts with no detection, radial contrast limits, and references to other high-resolution imaging papers if available.
Finding stellar sources close to transiting exoplanet host stars is, however, not only crucial to determining the planetary parameters correctly, but also to understanding the influence of binarity on the formation and evolution of planetary systems. Even though not all of the detected close stars are gravitationally bound, a lot of them are, as has been shown via multi-epoch high-resolution observations (e.g., Narita et al. 2012, Bergfors et al. 2013, Ngo et al. 2015). The effects of binarity may be manifold: stellar companions might stir (Mayer et al. 2005), tilt (Batygin 2012) or truncate the protoplanetary disk (Artymowicz & Lubow 1994), or they can interact with the formed planets via, for example the Lidov-Kozai mechanism or other secular interactions (Wu & Murray 2003; Fabrycky & Tremaine 2007; Naoz et al. 2011). Stellar companions may thus be one important cause of the variety observed in planetary system architectures.
Several groups have already done systematic surveys of stellar companions using either the Lucky Imaging method (e.g., Daemgen et al. 2009; Faedi et al. 2013; Bergfors et al. 2013; Lillo-Box et al. 2012, 2014; Wöllert et al. 2015), speckle imaging (e.g. Howell et al. 2011; Horch et al. 2014; Kane et al. 2014; Everett et al. 2015), or AO-assisted imaging on its own or combined with radial velocity methods (e.g., Adams et al. 2012, 2013; Guenther et al. 2013; Dressing et al. 2014; Law et al. 2014; Wang et al. 2014; Ngo et al. 2015). Or they have searched for the colour-dependency of the transit depths (e.g., Colón et al. 2012; Désert et al. 2015). However, more and more transiting exoplanets have been found, and their precise characterization will enable us to get a more precise view of the important mechanisms that shape planetary systems.
In this paper we present the results of our ongoing effort to find stellar sources close to TEP host stars. The observations and data reductions were performed similarly to our previous paper Wöllert et al. (2015) and are briefly described in Sect. 2. In Sect. 3 we present the astrometric and photometric properties of the observed sources, and we summarize our findings in Sect. 4.
2. Observations and data reduction
2.1. Sample selection
The initial goals of our survey were to focus on those TEPs with already existing measurements of the Rossiter-McLaughlin effect and to explore a possible relationship of the angle defined by the spin vectors of the TEP host star and the planetary orbit, and the presence or absence of a stellar companion. This selection criterion was later relaxed to include all TEP host stars bright enough (i≤ 13 mag) to facilitate high-quality Lucky Imaging. The majority of the targets were selected from TEPs that were identified either by the SuperWASP or the HatNet project. This was complemented by TEP hosts identified in other ground- or space-based surveys. We focused on stars without previous high-angular resolution observations, as well as on TEP host stars with previous detections of stellar companion candidates in order to derive constraints on the relative astrometry between TEP host and stellar companion candidate.
2.2. Lucky Imaging with AstraLux at Calar Alto
All observations were carried out at Calar Alto with the 2.2 m telescope in combination with the Lucky Imaging camera AstraLux Norte (Hormuth et al. 2008) during two observing runs, one night in October 2014 and three nights in March 2015. The targets were observed in SDSS i′ and z′-passbands using the same set-up as described in Wöllert et al. (2015). The field of view was 12′′ by 12′′ with the exoplanet host star separated by at least 4′′ from the image borders. Depending on the target brightness and observing conditions, we took between 10 000 and 54 000 individual frames with exposure times of 15 millisecond each so that the probability of getting a stable speckle pattern is sufficiently large. The individual AstraLux images are dark-subtracted and flat-fielded. For the data analysis we chose 10% of the images with the highest Strehl ratio and combined them using the shift-and-add technique.
To measure the separation and position angle of the companion candidates precisely, we took at least three images of the globular cluster M 13 each night. Using IRAF imexamine we determined the detector position of five widely separated stars in the field and calculated their separation and rotation angle pairwise. The result was compared to the values from high-quality astrometric HST/ACS observations. Because the instrument was not unmounted during the observing nights in March 2015, we used the images of all three nights for calibrating that run. The plate scale and detector rotation were 23.46±0.01 mas/px and 1.7°±0.1° west of north and 23.51±0.01 mas/px and 2.0°±0.1° west of north for the observations in October 2014 and March 2015, respectively.
2.3. Photometry and astrometry
To find all stellar sources, in addition to those that are faint and close to the transiting planet host star, we first subtracted the point spread function (PSF) of the TEP host. Because the PSFs vary significantly from image to image and no standard PSF can be used for all observations, we fitted a theoretical model PSF to each star. The theoretical model PSF comprises the PSF from an ideal telescope without atmosphere, which was then convolved with a Gaussian and finally added to a Moffat profile. The model also weights the two PSF components (see Wöllert et al. 2014, for more information on the procedure). If a companion candidate was found, we fitted a scaled and differently weighted PSF to it to determine its position and the flux ratio of the two components. We used the PSF subtracted images as well to calculate the 5σ-contrast curve. For this purpose, we divided the flux in a box of 5×5 pixel around each pixel by the flux of star in a similarly sized box centred on the peak in the original, but not PSF-subtracted image. The contrast at a specific separation is then calculated as the median of the contrast of all pixels at the corresponding separation. The contrast at r = 0.25′′, 0.5′′, 1.0′′, and 2.0′′ of targets with candidate companions is given in Table 1, and the contrast for all other targets is given in Table 2. Outside of 2.0′′, the contrast decreases only very little, and the value given for 2.0′′ can be assumed.
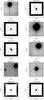 |
Fig. 1 z′ filter images of the 10 exoplanet host stars for which new companion candidates have been detected with the exception of HAT-P-35, for which the i′-image is shown. The grey scale is proportional to the square root of the count. To improve the visibility of the close companions to HAT-P-27, HAT-P-28, HAT-P-35, WASP-76, and WASP-103, we additionally applied unsharp masking. The orientation is identical for all images with north up and east to the left. |
TEP hosts with candidate companions, observing date, inferred astrometric position, and flux ratio in the observed passbands.
The flux ratio in both passbands was measured using the IDL routine APER that performs aperture photometry. We used an aperture size of 4.5 px, which is about the full width half maximum of the stellar PSFs. In contrast to the usual approach, the sky background was not measured in a close annulus around the star, but in a 50×50 px box in one corner of the image without a stellar source for the primary and at the opposite position of the TEP host with the same distance and aperture size for the fainter companion. This ensures that the flux contribution of the brighter TEP host is accurately subtracted from those of the fainter source because our PSFs are almost point symmetrical in shape. The uncertainties of the flux ratios are propagated from the statistical photometric errors given by APER and the systematic errors are from using this method. The latter were estimated by comparing the results obtained by using different aperture sizes, as well as the flux ratios determined by PSF-fitting.
3. Results
For the 74 observed TEP host stars, we find new candidate companions to HAT-P-27, HAT-P-28, HAT-P-35, WASP-76, and WASP-103 within 1′′, to HAT-P-29 and WASP-56 within 4′′, and the candidates of HAT-P-15, HAT-P-54, and Kepler-89 are situated outside of 4′′. Images in z′ of all these sources can be found in Fig. 1. In addition, we did follow-up observations of 23 already known companion candidates. The astrometric positions and flux ratios in i′ and z′ of all companions candidate can be found in Table 3.
As can also be seen in Table 3, most sources appear to be redder than the primary, which would be expected for a lower mass companion. The uncertainties are, however, too large to allow a precise estimate of the spectral type. To achieve this, adaptive-optics-based observations or spectra would be needed. The knowledge of the companion candidate spectral type would then allow the planetary parameter and infrared emission spectra of the new close companions to be corrected, as well as comparing their photometric distance to those of the TEP host star to investigate whether the sources may be gravitationally bound or not. For this purpose their astrometric position needs to be followed up on in the upcoming years as well.
4. Summary
In our ongoing Lucky Imaging search for stellar sources close to transiting exoplanet host stars, we identified five new, close sources within 1″ to HAT-P-27, HAT-P-28, HAT-P-35, WASP-76, and WASP-103, which have been overlooked so far. The planetary and stellar parameters and the thermal radiation profile of the transiting planets of these sources may have to be corrected according to the spectral type of the companion candidate star, which remains to be determined. Also, the detected companion candidates to HAT-P-29 and WASP-56, which are located at 3.3″ and 3.4″, respectively, to the TEP host could have this influence because the photometric aperture used for the transit observations, e.g. with Spitzer, are about that size. The sources that are outside of 4″ to HAT-P-15, HAT-P-54, and Kepler-89 do not influence the planetary and stellar property derivation from the transit light curve, but can be of interest if they happen to be bound to the TEP host. This needs to be investigated with astrometric observations in upcoming years. In this work, we also gave the astrometric positions and i′ and z′ flux ratios of 23 already known candidate companions.
Acknowledgments
M.W. acknowledges support by the International Max Planck Research School for Astronomy & Cosmic Physics in Heidelberg (IMPRS-HD).
References
- Adams, E. R., Ciardi, D. R., Dupree, A. K., et al. 2012, AJ, 144, 42 [NASA ADS] [CrossRef] [Google Scholar]
- Adams, E. R., Dupree, A. K., Kulesa, C., & McCarthy, D. 2013, AJ, 146, 9 [NASA ADS] [CrossRef] [Google Scholar]
- Alonso, R., Auvergne, M., Baglin, A., et al. 2008, A&A, 482, L21 [NASA ADS] [CrossRef] [EDP Sciences] [Google Scholar]
- Anderson, D. R., Collier Cameron, A., Delrez, L., et al. 2014, MNRAS, 445, 1114 [NASA ADS] [CrossRef] [Google Scholar]
- Artymowicz, P., & Lubow, S. H. 1994, ApJ, 421, 651 [NASA ADS] [CrossRef] [Google Scholar]
- Baglin, A., Auvergne, M., Barge, P., et al. 2006, in ESA SP 1306, eds. M. Fridlund, A. Baglin, J. Lochard, & L. Conroy, 33 [Google Scholar]
- Bakos, G., Noyes, R. W., Kovács, G., et al. 2004, PASP, 116, 266 [NASA ADS] [CrossRef] [Google Scholar]
- Bakos, G. Á., Hartman, J., Torres, G., et al. 2011, ApJ, 742, 116 [NASA ADS] [CrossRef] [Google Scholar]
- Batalha, N. M., Rowe, J. F., Bryson, S. T., et al. 2013, ApJS, 204, 24 [NASA ADS] [CrossRef] [Google Scholar]
- Batygin, K. 2012, Nature, 491, 418 [NASA ADS] [CrossRef] [PubMed] [Google Scholar]
- Beatty, T. G., Pepper, J., Siverd, R. J., et al. 2012, ApJ, 756, L39 [NASA ADS] [CrossRef] [Google Scholar]
- Bechter, E. B., Crepp, J. R., Ngo, H., et al. 2014, ApJ, 788, 2 [NASA ADS] [CrossRef] [Google Scholar]
- Bergfors, C., Brandner, W., Daemgen, S., et al. 2013, MNRAS, 428, 182 [NASA ADS] [CrossRef] [Google Scholar]
- Bieryla, A., Collins, K., Beatty, T. G., et al. 2015, AJ, 150, 12 [NASA ADS] [CrossRef] [Google Scholar]
- Borucki, W. J., Koch, D., Basri, G., et al. 2010, Science, 327, 977 [NASA ADS] [CrossRef] [PubMed] [Google Scholar]
- Brown, D. J. A., Anderson, D. R., Armstrong, D. J., et al. 2014, ArXiv e-prints [arXiv:1412.7761] [Google Scholar]
- Burke, C. J., Bryson, S. T., Mullally, F., et al. 2014, ApJS, 210, 19 [NASA ADS] [CrossRef] [Google Scholar]
- Collins, K. A., Eastman, J. D., Beatty, T. G., et al. 2014, AJ, 147, 39 [NASA ADS] [CrossRef] [Google Scholar]
- Colón, K. D., Ford, E. B., & Morehead, R. C. 2012, MNRAS, 426, 342 [NASA ADS] [CrossRef] [Google Scholar]
- Crossfield, I. J. M., Barman, T., Hansen, B. M. S., Tanaka, I., & Kodama, T. 2012, ApJ, 760, 140 [NASA ADS] [CrossRef] [Google Scholar]
- Crossfield, I. J. M., Petigura, E., Schlieder, J. E., et al. 2015, ApJ, 804, 10 [NASA ADS] [CrossRef] [Google Scholar]
- Daemgen, S., Hormuth, F., Brandner, W., et al. 2009, A&A, 498, 567 [NASA ADS] [CrossRef] [EDP Sciences] [Google Scholar]
- Deleuil, M., Deeg, H. J., Alonso, R., et al. 2008, A&A, 491, 889 [NASA ADS] [CrossRef] [EDP Sciences] [Google Scholar]
- Désert, J.-M., Charbonneau, D., Torres, G., et al. 2015, ApJ, 804, 59 [NASA ADS] [CrossRef] [Google Scholar]
- Dressing, C. D., Adams, E. R., Dupree, A. K., Kulesa, C., & McCarthy, D. 2014, AJ, 148, 78 [NASA ADS] [CrossRef] [Google Scholar]
- Everett, M. E., Barclay, T., Ciardi, D. R., et al. 2015, AJ, 149, 55 [NASA ADS] [CrossRef] [Google Scholar]
- Fabrycky, D., & Tremaine, S. 2007, ApJ, 669, 1298 [NASA ADS] [CrossRef] [Google Scholar]
- Faedi, F., Staley, T., Gómez Maqueo Chew, Y., et al. 2013, MNRAS, 433, 2097 [NASA ADS] [CrossRef] [Google Scholar]
- Fischer, D. A., Schwamb, M. E., Schawinski, K., et al. 2012, MNRAS, 419, 2900 [NASA ADS] [CrossRef] [Google Scholar]
- Gandolfi, D., Hébrard, G., Alonso, R., et al. 2010, A&A, 524, A55 [NASA ADS] [CrossRef] [EDP Sciences] [Google Scholar]
- Guenther, E. W., Fridlund, M., Alonso, R., et al. 2013, A&A, 556, A75 [NASA ADS] [CrossRef] [EDP Sciences] [Google Scholar]
- Hartman, J. D., Bakos, G. Á., Béky, B., et al. 2012, AJ, 144, 139 [NASA ADS] [CrossRef] [Google Scholar]
- Horch, E. P., Howell, S. B., Everett, M. E., & Ciardi, D. R. 2014, ApJ, 795, 60 [NASA ADS] [CrossRef] [Google Scholar]
- Hormuth, F., Brandner, W., Hippler, S., & Henning, T. 2008, J. Phys. Conf. Ser., 131, 012051 [Google Scholar]
- Howell, S. B., Everett, M. E., Sherry, W., Horch, E., & Ciardi, D. R. 2011, AJ, 142, 19 [NASA ADS] [CrossRef] [EDP Sciences] [Google Scholar]
- Johnson, J. A., Apps, K., Gazak, J. Z., et al. 2011, ApJ, 730, 79 [NASA ADS] [CrossRef] [Google Scholar]
- Kane, S. R., Howell, S. B., Horch, E. P., et al. 2014, ApJ, 785, 93 [NASA ADS] [CrossRef] [Google Scholar]
- Law, N. M., Morton, T., Baranec, C., et al. 2014, ApJ, 791, 35 [NASA ADS] [CrossRef] [Google Scholar]
- Lillo-Box, J., Barrado, D., & Bouy, H. 2012, A&A, 546, A10 [NASA ADS] [CrossRef] [EDP Sciences] [Google Scholar]
- Lillo-Box, J., Barrado, D., & Bouy, H. 2014, A&A, 566, A103 [NASA ADS] [CrossRef] [EDP Sciences] [Google Scholar]
- Maxted, P. F. L., Anderson, D. R., Collier Cameron, A., et al. 2013, PASP, 125, 48 [NASA ADS] [CrossRef] [Google Scholar]
- Mayer, L., Wadsley, J., Quinn, T., & Stadel, J. 2005, MNRAS, 363, 641 [NASA ADS] [CrossRef] [Google Scholar]
- Montet, B. T., Johnson, J. A., Muirhead, P. S., et al. 2015, ApJ, 800, 134 [NASA ADS] [CrossRef] [Google Scholar]
- Moya, A., Bouy, H., Marchis, F., Vicente, B., & Barrado, D. 2011, A&A, 535, A110 [NASA ADS] [CrossRef] [EDP Sciences] [Google Scholar]
- Naoz, S., Farr, W. M., Lithwick, Y., Rasio, F. A., & Teyssandier, J. 2011, Nature, 473, 187 [NASA ADS] [CrossRef] [Google Scholar]
- Narita, N., Takahashi, Y. H., Kuzuhara, M., et al. 2012, PASJ, 64, L7 [NASA ADS] [Google Scholar]
- Ngo, H., Knutson, H. A., Hinkley, S., et al. 2015, ApJ, 800, 138 [NASA ADS] [CrossRef] [Google Scholar]
- Pepper, J., Siverd, R. J., Beatty, T. G., et al. 2013, ApJ, 773, 64 [NASA ADS] [CrossRef] [Google Scholar]
- Pollacco, D. L., Skillen, I., Collier Cameron, A., et al. 2006, PASP, 118, 1407 [NASA ADS] [CrossRef] [Google Scholar]
- Roell, T., Neuhäuser, R., Seifahrt, A., & Mugrauer, M. 2012, A&A, 542, A92 [NASA ADS] [CrossRef] [EDP Sciences] [Google Scholar]
- Sanchis-Ojeda, R., Winn, J. N., Marcy, G. W., et al. 2013, ApJ, 775, 54 [NASA ADS] [CrossRef] [Google Scholar]
- Santerne, A., Moutou, C., Barros, S. C. C., et al. 2012, A&A, 544, L12 [NASA ADS] [CrossRef] [EDP Sciences] [Google Scholar]
- Siverd, R. J., Beatty, T. G., Pepper, J., et al. 2012, ApJ, 761, 123 [Google Scholar]
- Smith, A. M. S., Anderson, D. R., Collier Cameron, A., et al. 2012, AJ, 143, 81 [NASA ADS] [CrossRef] [Google Scholar]
- Wang, J., Fischer, D. A., Xie, J.-W., & Ciardi, D. R. 2014, ApJ, 791, 111 [NASA ADS] [CrossRef] [Google Scholar]
- Winn, J. N., Noyes, R. W., Holman, M. J., et al. 2005, ApJ, 631, 1215 [NASA ADS] [CrossRef] [Google Scholar]
- Wöllert, M., Brandner, W., Reffert, S., et al. 2014, A&A, 564, A10 [NASA ADS] [CrossRef] [EDP Sciences] [Google Scholar]
- Wöllert, M., Brandner, W., Bergfors, C., & Henning, T. 2015, A&A, 575, A23 [NASA ADS] [CrossRef] [EDP Sciences] [Google Scholar]
- Wu, Y., & Murray, N. 2003, ApJ, 589, 605 [NASA ADS] [CrossRef] [EDP Sciences] [Google Scholar]
All Tables
TEP hosts with detection, radial contrast limits, and references to other high-resolution imaging papers if available.
TEP hosts with no detection, radial contrast limits, and references to other high-resolution imaging papers if available.
TEP hosts with candidate companions, observing date, inferred astrometric position, and flux ratio in the observed passbands.
All Figures
|
Fig. 1 z′ filter images of the 10 exoplanet host stars for which new companion candidates have been detected with the exception of HAT-P-35, for which the i′-image is shown. The grey scale is proportional to the square root of the count. To improve the visibility of the close companions to HAT-P-27, HAT-P-28, HAT-P-35, WASP-76, and WASP-103, we additionally applied unsharp masking. The orientation is identical for all images with north up and east to the left. |
| In the text | |
Current usage metrics show cumulative count of Article Views (full-text article views including HTML views, PDF and ePub downloads, according to the available data) and Abstracts Views on Vision4Press platform.
Data correspond to usage on the plateform after 2015. The current usage metrics is available 48-96 hours after online publication and is updated daily on week days.
Initial download of the metrics may take a while.