| Issue |
A&A
Volume 579, July 2015
|
|
|---|---|---|
| Article Number | L6 | |
| Number of page(s) | 7 | |
| Section | Letters | |
| DOI | https://doi.org/10.1051/0004-6361/201526366 | |
| Published online | 06 July 2015 | |
Chemical abundances of giant stars in the Crater stellar system⋆,⋆⋆
1 GEPI, Observatoire de Paris, PSL Research University, CNRS, Univ. Paris Diderot, Sorbonne Paris Cité, Place Jules Janssen, 92195 Meudon, France
e-mail: This email address is being protected from spambots. You need JavaScript enabled to view it.
2 Istituto Nazionale di Astrofisica, Osservatorio Astronomico di Padova, Vicolo dell’Osservatorio 5, 35122 Padova, Italy
3 UPJV, Université de Picardie Jules Verne, 33 rue St Leu, 80080 Amiens, France
4 Millennium Institute of Astrophysics, Casilla 306, Santiego 22, Chile
5 Pontificia Universidad Católica de Chile Vicuña MacKenna 4860, Macul, Santiago, Chile
6 Department of Astronomy and Astronomical Observatory, Odessa National University, and Isaac Newton Institute of Chile Odessa branch, Shevchenko Park, 65014 Odessa, Ukraine
Received: 20 April 2015
Accepted: 9 June 2015
Abstract
Aims. We obtained spectra for two giants of Crater (Crater J113613-105227 and Crater J113615-105244) using X-Shooter at the VLT, with the purpose of determining their radial velocities and metallicities.
Methods. Radial velocities were determined by cross-correlating the spectra with that of a standard star. The spectra were analysed with the MyGIsFOS code using a grid of synthetic spectra computed from one-dimensional, local thermodynamic equilibrium (LTE) model atmospheres. Effective temperature and surface gravity were derived from photometry measured from images obtained by the Dark Energy Survey.
Results. The radial velocities are 144.3 ± 4.0 km s-1 for Crater J113613-105227 and and 134.1 ± 4.0km s-1 for Crater J113615-105244. The metallicities are [Fe/H] = −1.73 and [Fe/H] = −1.67, respectively. In addition to the iron abundance, we were able to determine abundances for nine elements: Na, Mg, Ca, Ti, V, Cr, Mn, Ni, and Ba. For Na and Ba we took into account deviations from LTE because the corrections are significant. The abundance ratios are similar in the two stars and resemble those of Galactic stars of the same metallicity. In the deep photometric images we detected several stars that lie to the blue of the turn-off.
Conclusions. The radial velocities imply that both stars are members of the Crater stellar system. The difference in velocity between the two taken at face value implies a velocity dispersion >3.7 km s-1 at a 95% confidence level. Our spectroscopic metallicities agree excellently well with those determined by previous investigations using photometry. Our deep photometry and the spectroscopic metallicity imply an age of 7 Gyr for the main population of the system. The stars to the blue of the turn-off can be interpreted as a younger population that is of the same metallicity and an age of 2.2 Gyr. Finally, spatial and kinematical parameters support the idea that this system is associated with the galaxies Leo IV and Leo V. All the observations favour the interpretation of Crater as a dwarf galaxy.
Key words: stars: abundances / stars: Population II / globular clusters: general / galaxies: abundances / Local Group
Based on observations taken at ESO Paranal with the Kueyen telescope, programme 094.D-0547.
Tables 3−4, Figs. 4−5, and Appendices are available in electronic form at http://www.aanda.org
MERAC fellow.
© ESO, 2015
1. Introduction
The compact stellar system Crater has been independently discovered by Belokurov et al. (2014) from the ATLAS ESO VST survey1 (Shanks et al. 2013) supplemented with deep imaging with the WHT 4m telescope, and by Laevens et al. (2014) from the Pan-STARRS1 Survey2 (Chambers & PS1 Science Consortium 2015), supplemented by deep photometry with ESO/MPG 2.2 m telescope. Laevens et al. (2014) referred to the system as PSO J174.0675-10.8774, in the present paper we adopt the naming proposed by Belokurov et al. (2014), which is more in line with the current convention of naming new dwarf galaxies from the constellations in which they reside: Crater. The two investigations substantially agree with respect to the distance of the system: between 145 kpc and 170 kpc for Belokurov et al. (2014) and 145 kpc ± 17 kpc according to Laevens et al. (2014). They also agree on the estimate of the metallicity of the system: <−1.8 according to Belokurov et al. (2014), −1.9 according to Laevens et al. (2014). However, the two investigations depart significantly as to the nature of the stellar system. Belokurov et al. (2014) interpreted it as a dwarf galaxy satellite of the Milky Way, although the hypothesis that it is a peculiar globular cluster (GC) is also discussed. This interpretation is supported by the existence of a few bright blue stars present within in the stellar system, which can be interpreted as young blue-loop giants, resulting from a recent star formation episode. In addition, in support of the dwarf galaxy interpretation, Belokurov et al. (2014) pointed out that the horizontal branch (HB) of the system is quite red and not very extended: such a morphology of the HB is not compatible with low metallicity. Low-metallicity GCs show HBs that are very extended to the blue. Laevens et al. (2014) instead interpreted the system as a distant GC, for which they derived a precise distance, metallicity, and age (8 Gyr). If this interpretation is correct, then the bright blue stars observed in the system are either blue stragglers or non-members. It should be stressed that no other such “young” metal-poor GC has been observed to date. Such a system could have been formed in a currently disrupted satellite galaxy and now been accreted to the Milky Way halo.
In this Letter we present the result of spectroscopic observations of two of the brightest giants of Crater. Our main motivation was to determine radial velocities and metallicities for the two stars.
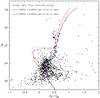 |
Fig. 1 Colour−magnitude diagram in g and r bands of the Crater stars within 50.̋0 from the centre, based on the DES public images. The two target stars are identified as large green dots. Overplotted are shown two PARSEC isochrones for a 7 Gyr and a 2.2 Gyr old stellar population. A reddening correction of E(B−V) = 0.023, as deduced from the maps of Schlegel et al. (1998), has been applied to the isochrones. |
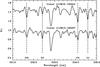 |
Fig. 2 Portion of the X-Shooter normalised spectra of the two stars, R.I. is the residual intensity. The spectrum of Crater J113615-105244 has been displaced vertically by 0.5 for display purposes. Only lines that have been used in the abundance analysis are identified. |
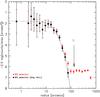 |
Fig. 3 Radial profile of Crater. The red squares are the raw counts of Crater stars selected along the stellar sequence; the filled circles represent the counts corrected for foreground contamination using the colour−magnitude diagram. The solid line is the best-fitting King model (King 1966), and the position of the tidal radius is indicated by a downward arrow. |
2. Target selection, observations, and analysis
In the two photometries presented by Belokurov et al. (2014) and Laevens et al. (2014), two luminous red giant stars are visible at g ≈ 20 at ≃2 mag over the HB. From our previous experience with X-Shooter and the Exposure Time calculator, we estimated that the stars were bright enough to obtain a spectrum suitable for measuring radial velocities with X-Shooter and determine abundances in about four hours of exposure for each star. We retrieved g, r public images from the ESO archive and catalogues of Data Release 1 of VST ATLAS and used them to identify the stars and provide the coordinates used for the observation. Since magnitudes in the catalogue were obtained with aperture photometry, we ran DAOPHOT/ALLSTAR on the released images to extract PSF photometry to improve the coordinates and photometry of the targets, which are already at the detection limit. The final photometry was corrected for illumination using the ATLAS DR1 catalogue.
We subsequently retrieved public g,r deep images observed in the course of the Dark Energy Survey (DES; Abbott et al. 2005; Diehl et al. 2014) from the NOAO Science Archive3. We used two images, obtained from the stacking of several short exposures, for each band for a total time of 6240 s (3720+2520). The seeing of the images is quite good ≃0.8 ÷ 0.9 arcsec. We extracted PSF photometry with DAOPHOT/ALLSTAR and used the multiple exposures to obtain a deeper photometry with ALLFRAME. The final g,r catalogue was calibrated with the ATLAS DR1 photometry, which is tied to the APASS system (Henden & Munari 2014; Munari et al. 2014). Magnitudes are AB magnitudes and should be on the DECAM system. The DES adopted photometry was used to create the g,r colour-magnitude diagram of Crater as shown in Fig. 1, where the two observed stars are highlighted in green. Coordinates and photometry for our stars are given in Table 1. The two stars are quite centrally located in Crater. Our observing programme was to observe each star with X-Shooter (Vernet et al. 2011) with the Integral Field Unit, which re-images an input field of 4′′ × 1.8′′ onto a pseudo slit of  (Guinouard et al. 2006). Four observing blocks (OBs) of one hour each should have provided 12 136 s of integration on each star as well as a resolving power of R = 7900 in the UVB arm and 12 600 in the VIS arm. Four OBS on Crater J113613-105227 were executed, but only two OBs on Crater J113615-105244. Although with a lower signal-to-noise than we had expected, the latter spectra turned out to be of sufficient quality for our analysis. The spectra were reduced as described in Caffau et al. (2011). The signal-to-noise ratio of the coadded spectra at 530 nm was about 60 for Crater J113613-105227 and about 40 for Crater J113615-105244. A portion of the spectra is shown in Fig. 2.
Observing and measured parameters of our programme stars.
Results of the fit of a King model to the MS stars of Crater.
2.1. Photometry
We used the DES deep photometry to measure the size of Crater. From the colour-magnitude diagram we selected Crater stars brighter than r = 25.0 (i.e. ≃1 mag below the turn-off, TO) along the old stellar sequence taking into account the local errors in colour, and we used this sample to determine the centre of Crater. We excluded the blue stars above the TO and counted the number of stars per unit area in radial annuli as a function of distance from the centre. The results of these counts are shown in Fig. 3. We fitted a King model (King 1966) to these number counts, and the results of our best fit are provided in Table 2. These compare well to what was determined by Laevens et al. (2014) assuming a King model, although we point out that we derived a smaller core-radius and a larger (almost a factor of 2) tidal radius. The reason is probably that DES photometry is deeper than the WFI photometry of Laevens et al. (2014). The colour-magnitude diagram shown in Fig. 1 for the stars ≤50.̋0 or ≤1.9 core radii from the centre confirms that the dominant population of Crater is of intermediate age. The PARSEC isochrones of the Padova Group (Bressan et al. 2012) in the DECAM AB system for a metallicity of [Fe/H] = −1.5 (Z = 4.5 × 10⁻⁴), and reddened for the extinction expected for Crater from the Schlegel et al. (1998) maps, are in favour of a younger age of ≃7 Gyr compared to the analysis of Belokurov et al. (2014). We do not see a very young population of ≃400 Myr, but the good seeing and cleaner photometry allow us to identify a population of objects ≈1.5 mag above the turn-off region. We visually inspected these objects to verify that they are not background compact galaxies or image artefacts, and they all appear to be stellar objects. The younger population is compatible with an age of ~2.2 Gyr and the metallicity is compatible with the one of the main population. A population of blue stragglers with a mass of ≃1.4 M⊙. might account for some of the younger potential MS population, but the almost horizontal track of points heading toward the sub-giant branch does not follow an expected blue-straggler locus. With our analysis we measured a distance modulus of (M−m)0 = 20.91 ± 0.1 mag or a distance of 152 kpc, confirming the distance found by the previous authors.
2.2. Radial velocity
We measured the radial velocities given in Table 1 by cross-correlating each individual exposure in the UVB arm against the X-Shooter spectrum of HD 165195, taken from the X-Shooter spectral library (Chen et al. 2014). This star has atmospheric parameters quite close to our programme stars. We then applied the barycentric correction to the radial velocities and added a zero-point correction. The zero-point correction was derived for each exposure from the [OI] 577.7 nm atmospheric emission line. The zero-point corrections are probably due to a combination of flexures in the spectrograph, variation in temperature, and pressure in the surroundings with respect to when the calibration Th–Ar was taken, as well as centring of the star on the IFU. The use of an emission line is not optimal for this purpose, since the illumination of the slit is different for the sky emission and for the star, but we do not have strong enough telluric absorprion lines to use in the UVB arm. Interestingly, Schönebeck et al. (2014) have performed several measurements of the [OI] 577.7 nm line at different positions on the slit on X-Shooter slit spectra, and the dispersion of their measurements is of only 0.6 km s-1. We cannot make use of the VIS spectra for the radial velocities for two reasons: since the stars are metal-poor, there are few lines in the VIS range, and the observations were made by tracking at 470 nm, thus the UVB spectrum is expected to remain well centred, while the VIS spectrum probably shows larger deviations during the exposure4.
Then we computed a weighted average of the radial velocities, with weights that are proportional to the number of counts in the spectrum in the region 490−550 nm. The use of a straight average changes the mean by less than 0.1 km s-1.
Measuring the radial velocities on the indivudal spectra has the additional advantage that the dispersion in the measurements provides an estimate of the error. For Crater J113613-105227, this is 4 km s-1, while it is 0.4 km s-1 for Crater J113615-105244. We take the former as our error estimate, since the spectra were taken on three different nights and probe different instrument flexures, ambient temperature, and star centring, while the two spectra of Crater J113615-105244 were taken on the same night, one after the other. The latter do provide an estimate of the statistical error in our radial velocity measurements. Our error estimate is in line with the quoted accuracy of the calibration of the X-Shooter UVB and VIS arms (Goldoni 2011, 2 km s-1). The difference in radial velocity, 10.2km s-1, allows us to confirm that the two stars belong to the same stellar system. This was expected because the stars are near the centre of Crater, as can be appreciated in Fig. 4. The average radial velocity of Crater is 139.2 ± 4.km s-1. The radial velocity in the Galactic standard of rest is v(GSR) = −5.7 ± 4.km s-1 using the Dehnen & Binney (1998) correction for the solar motion and a correction for the rotation of the Galaxy of 220.0km s-1.
2.3. Abundance analysis
To analyse the spectra, we used our code MyGIsFOS (Sbordone et al. 2014) and a grid of synthetic spectra appropriate for metal-poor giants, computed from our grid of ATLAS 12 models (Sbordone et al., in prep.; Kurucz 2005; Castelli 2005) covering the metallicity range −3.0 to −1.0. The spectra were computed assuming local thermodynamic equilibrium (LTE). For both stars we adopted the atmospheric parameters as read from the 7 Gyr isochrone that is shown in Fig. 1. The adopted surface gravites are also supported by the iron ionisation equilibria, even though we have only two Fe ii lines in Crater J113613-105227 and one in Crater J113615-105244. MyGIsFOS is also capable of determining the temperature from the Fe i excitation equilibrium. Since in metal-poor giants the Fe i lines can deviate significantly from LTE (see e.g. Mashonkina et al. 2011, and references therein), we decided that the isochrones and the colour-magnitude diagram provide a more robust estimate of the effective temperature. It is not possible to measure lines on the linear part of the curve-of-growth at the resolution of X-Shooter, thus one has no information on the microturbulent velocity. This parameter, which has to be introduced when using one-dimensional static model atmospheres as done here, depends on the atmospheric parameters. We decided to adopt 2.0 km s-1 for the microturbulent velocity because this was measured by Cayrel et al. (2004) for HD 122563. This star has a Teff and log g similar to our stars, but a lower metallicity. Monaco et al. (2005) derived a calibration of the microturbulent velocity as a function of Teff and log g for metallicities in the range −0.5 to −1.0. Their calibration implies microturbulent velocities ≈1.8 km s-1.
For Na and Ba, which are known to be strongly affected by deviations from LTE, we derived the abundances from fitting line profiles with theoretical profiles computed in NLTE with the code MULTI (Carlsson 1986) as modified by Korotin et al. (1999) and Korotin & Mishenina (1999). For Na we relied on the Na i D doublet, the model atom used is the same as in Andrievsky et al. (2007). To derive the Ba abundances, we used the the 614.15 nm Ba ii line for both stars, and for star Crater J113615-105244 we also used the 445.4 nm line. We used the model atom described in Andrievsky et al. (2009).
The derived abundances for the two stars are given in Table 3. The effects of systematic errors due to different assumptions on Teff, log g, and microturbulent velocities for star Crater J113613-105227 are clearly visible in Table 4.
As a check of our method, we also analysed the X-Shooter spectrum of HD 165195 with MyGIsFOS. We assumed Teff = 4500 K, log g = 1.1, and a microturbulence of 1.6 km s-1, as found by Bonifacio et al. (1999). The derived [Fe/H] is −2.08, very close to what was found by Bonifacio et al. (1999, –1.92); this confirms the soundness of our method.
The derived abundances are consistent with the metallicity derived from the isochrone fits. The PARSEC ischrones assume solar-scaled abundances. Our detailed analysis reveals that the stars are instead α-enhanced. Salaris et al. (1993) have shown that for metal-poor stars an α-enhanced isochrone can be mimicked by a solar-scaled one of higher metallicity. Using their prescription and the mean of our measured [Fe/H] and [α/Fe], we find that our stars probably are compatible with an isochrone that is only about 0.1 dex more metal-rich than the one shown in Fig. 1. This is well within the errors of our abundance measurements and the isochrone-fitting procedure.
3. Discussion
Our spectroscopic results confirm the metallicity estimated from the photometry by Belokurov et al. (2014) and Laevens et al. (2014). The abundance pattern of the two stars does not show any signature that distinguishes it from halo stars. The α elements are enhanced over iron, and the iron peak elements follow iron. Na is underabundant by roughly a factor of two with respect to iron in both stars, as found in Galactic halo stars at this metallicity.
The radial velocity of the system is very interesting (see Sect. 2.2). Belokurov et al. (2014) have already pointed out that Crater, Leo IV, and Leo V all lie on a great circle with a pole at (α,δ) = (83°.1,−5°.3). de Jong et al. (2010) suggested that Leo IV and Leo V are connected by a “bridge of stars” and could have been accreted by the Galaxy as a pair. Belokurov et al. (2014) suggested that Crater may in fact be a member of the same group of galaxies. Our measured radial velocity and confirmed distance from the DES photometry strongly supports this hypothesis. This is illustrated in Fig. 5, where we show the positional and kinematical properties of the three galaxies, together with the orbits computed by de Jong et al. (2010) under the assumption that Leo IV and Leo V have a common energy and angular momentum.
The association of Crater with the other two dwarf galaxies is evidence that favours the interpretation of Belokurov et al. (2014). It might be argued that Crater is a GC associated with either Leo IV or Leo V. This would make this whole system very exceptional because with the exception of the Magellanic Clouds, the only Milky Way satellites that harbour GCs are the two most massive dwarf spheroidals: Sagittarius and Fornax. The presence of a GC system seems to be associated with a high mass; it would be very unusual if Leo IV or Leo V, which have masses a factor of one thousand lower than Sagittarius or Fornax (McConnachie 2012), were indeed possessed of such satellites.
The fact that the Galactocentric radial velocity of Crater is so low implies that it is either close to peri-Galacton, or apo-Galacticon, or on an orbit that is nearly circular. If the latter is true, or if the star is close to peri-Galacticon, then Crater is spending most of its time at large distances (>150 kpc) from the Galactic centre, thus minimising the stripping effect of the Galactic tidal field on the gas. This could explain why this dwarf galaxy has been able to retain gas up to at least 2.2 Gyr ago and form a second generation of stars.
The radial velocities of the two stars observed by us differ by 10.2 km s-1. In Appendix A we show that, ignoring errors on the radial velocity, this implies a lower limit on the dispersion σv> 3.7km s-1 with a 95% confidence.
Globular clusters are known to have several tight relations that connect their main structural parameters. One of them is the fundamental plane, which involves the central velocity dispersion, central density, and core radius (Djorgovski 1995). Another is a relation that involves the total luminosity and the velocity dispersion (Djorgovski & Meylan 1994). We can therefore compare the velocity dispersion of Crater with those of GCs. For a total luminosity of –5.5 (Belokurov et al. 2014) or −4.3 (Laevens et al. 2014) for Crater, we expect a dispersion of 2.5 ÷ 4.0km s-1. For a proper comparison, the ageing of the whole stellar population of Crater needs to be taken into account. Crater is about 5 ÷ 6 Gyr younger than the average population of GCs, which is of the order of 12 ÷ 13 Gyr. In the comparison, Crater should migrate at fainter magnitudes while not changing the velocity dispersion, which is barely affected. Although the comparison does not allow a strong disctinction between Crater being a GC or a dwarf galaxy, it certainly does not favour it being a GC.
Dwarf galaxies have dynamical masses higher than the masses estimated from their luminosities (Mdyn ≫ M∗), while for GCs the two masses are of the same order of magnitude. Our proposed lower limit on the velocity dispersion can be combined with the radius and distance of Crater to show that the dynamical mass of Crater is MCrater> 1.5M47 Tuc (if we assume the radius measured by Laevens et al. 2014; >1.8M47 Tuc if we use the larger radius measured by Belokurov et al. 2014, see Appendix for details). When coupled with the luminosities of Crater (MV = −4.3, Laevens et al. 2014) and 47 Tuc (−9.42, Harris 2010), this immediately tells us that Crater must contain a significant fraction of dark matter. This consideration could, by itself, answer the question and classify Crater as a dwarf galaxy. Only two stars have been measured, however, which weakens this argument very much (e.g. one of the two stars could be a binary or a radial velocity variable), and more measurements are certainly required to draw a firm conclusion.
Stars bluer than the turn-off may be explained as a younger population, which is another observation favouring the interpretation of Crater as a dwarf galaxy. Although it might be argued that these stars could be blue stragglers, they would appear to be too numerous for the cluster’s luminosity. Momany (2015) showed that the logarithm of the ratio of the number of blue stragglers to horizontal branch stars in GCs has a clear anti-correlation with cluster luminosity. This anti-correlation is less tight for open clusters and dwarf galaxies that occupy different regions in this plane. If we count all stars to the blue of the turn-off in Crater as blue stragglers and compare to the number of HB stars (see the two boxes in Fig. 1), this would place it in a region of Fig. 6.4 of Momany (2015) that is mainly populated by dwarf galaxies and open clusters, but not by GCs. Therefore even interpreting the blue stars as blue stragglers would not support the notion that Crater is a typical GC.
The photometry suggests that the metallicity of this younger population has the same metallicity of the main population; this is expected. Such low-mass galaxies (Laevens et al. 2014 estimated 6.8 × 10³ M⊙) are expected to show a low metallicity dispersion. The reason is that they cannot effectively retain supernova ejecta.
We summarise the four observations that all favour the interpretation of Crater as a dwarf galaxy.
-
1.
The likely association of Crater with Leo IV and Leo V, on thebasis of its radial velocity.
-
2.
The population blueward of the turn-off in the colour−magnitude diagram, which can be interpreted as a population that is 4.5 Gyr younger than the dominant population.
-
3.
The lower limit to the velocity dispersion in the system implies that Crater is more massive than 47 Tuc. Since it is also less luminous than 47 Tuc, it must contain a significant fraction of dark matter.
-
4.
Crater does not lie on the fundamental plane of GCs.
These observations are circumstantial, however, and cannot rule out the possibility that the system is a GC, if an atypical one. Nevertheless, from the information currently available, the dwarf galaxy hypothesis seems more plausible.
Online material
Detailed abundances.
Variations in stellar parameters for different assumptions on Teff, log g, and microturbulent velocity.
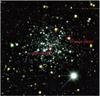 |
Fig. 4 Colour image created from DES, g,r,i images showing the location of the two target stars. |
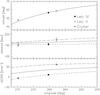 |
Fig. 5 Updated version of Fig. 7 of de Jong et al. (2010). The radial velocity (lower panel), distance (middle panel), and sky position (upper panel) of Crater (shown as a star) compared to those of Leo IV (empty dot) and Leo V (filled dot). The lines are the orbits for Leo IV and Leo V, computed by de Jong et al. (2010), assuming common energy and angular momentum for the two galaxies, using Leo IV and Leo V (dotted line) as initial conditions, or their mean properties (dashed line), respectively. |
Appendix A: Lower limit to the radial velocity dispersion
The difference of two normal random variables with means μ1,μ2), and standard deviations σ1,σ2 follows a normal distribution, with  and mean μ1−μ2. Assuming that the velocity distribution is normal and ignoring the measurement errors, the velocity difference between two stars is expected to be normally distributed with a mean of 0 km s-1 and a standard deviation of
  , where σv is the standard deviation of the original distribution. Using the table on p. 253 of Bevington & Robinson (1992), which provides the integral of a Gaussian distribution, we derive that the integral between −1.96 ≤ z ≤ + 1.96 is 0.95, where
  and μ is the mean. In our case, x = 10.2km s-1, μ = 0 km s-1 and
  ; this implies that z = 1.96 corresponds σv = 3.7km s-1. In other words, there is a 95% probability that the parent velocity distribution has a σ> 3.7km s-1. If we take into account the errors, no conclusion can be reached because the measured radial velocities of the two stars are also consistent with a zero radial velocity dispersion.
Appendix B: Lower limit to the dynamical mass of Crater
To derive a lower limit, we assumed that Crater and the globular cluster 47 Tuc are in dynamical equilibrium and that the virial theorem applies. For this system, the mass, M, can be expressed in terms of its velocity dispersion, σ, and exponential radius, rh (see e.g. Spitzer 1987) :  (B.1)where G is the gravitational constant. We thus may write
 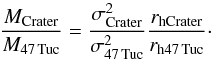 (B.2)Because we only have a lower limit for σCrater, this becomes
 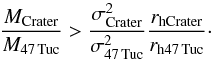 (B.3)We assumed for Crater σCrater> 3.7km s-1, rhCrater = 0.47′ (Laevens et al. 2014) or rhCrater = 0.6′ (Belokurov et al. 2014) and a distance of 145 kpc (Laevens et al. 2014). For 47 Tuc we assumed σ47 Tuc = 7km s-1 a median value from Kučinskas et al. (2014), rh47 Tuc = 174′′ (Trager et al. 1993), and a distance of 4.5 kpc (Harris 2010).
With these values, we obtain  for the radius measured by Laevens et al. (2014) and
  for the radius measured by Belokurov et al. (2014). Either way, it is clear that Crater is more massive (dynamically) than 47 Tuc. Even disregarding the velocity dispersions, it might have been suspected that this is the case because the radius of Crater is larger than that of 47 Tuc. Of course, if Crater is not in dynamical equlibrium, this reasoning does not hold.
See the X-Shooter manual-page 27 https://www.eso.org/sci/facilities/paranal/instruments/xshooter/doc/VLT-MAN-ESO-14650-4942_P96.pdf
Acknowledgments
We are grateful to the anonymous referee, who helped us to improve the paper and pointed out to us that the almost horizontal track of the young population SGB does not follow the expected blue-straggler locus and that Crater must be near peri- or apo-galacticon or on a nearly circular orbit, providing an argument in favour of its ability to retain gas. The project was funded by FONDATION MERAC. P.B., E.C., P.F., M.S., F.S., and R.C. acknowledge support from the Programme National de Cosmologie et Galaxies (PNCG) and Programme National de Physique Stellaire (PNPS) of the Institut National de Sciences de l’Univers of CNRS. Support for L.S. was provided by Chile’s Ministry of Economy, Development, and Tourism’s Millennium Science Initiative through grant IC120009, awarded to The Millennium Institute of Astrophysics, MAS. S.Z. acknowledges that this research was supported in part by the National Science Foundation under Grant No. NSF PHY11-25915 and by PRIN INAF 2014 − CRA 1.05.01.94.05 “Star won’t tell their ages to GAIA”. S.Z. warmly thank P. Ochner for useful observations at the Asiago telescopes.
References
- Abbott, T. G., Aldering, J. Annis, et al. 2005, ArXiv e-prints [arXiv:astro-ph/0510346] [Google Scholar]
- Andrievsky, S. M., Spite, M., Korotin, S. A., et al. 2007, A&A, 464, 1081 [NASA ADS] [CrossRef] [EDP Sciences] [Google Scholar]
- Andrievsky, S. M., Spite, M., Korotin, S. A., et al. 2009, A&A, 494, 1083 [NASA ADS] [CrossRef] [EDP Sciences] [Google Scholar]
- Belokurov, V., Irwin, M. J., Koposov, S. E., et al. 2014, MNRAS, 441, 2124 [NASA ADS] [CrossRef] [Google Scholar]
- Bevington, P. R., & Robinson, D. K. 1992 (New York: McGraw-Hill) [Google Scholar]
- Bonifacio, P., Centurion, M., & Molaro, P. 1999, MNRAS, 309, 533 [NASA ADS] [CrossRef] [Google Scholar]
- Bressan, A., Marigo, P., Girardi, L., et al. 2012, MNRAS, 427, 127 [NASA ADS] [CrossRef] [Google Scholar]
- Caffau, E., Bonifacio, P., François, P., et al. 2011, A&A, 534, A4 [NASA ADS] [CrossRef] [EDP Sciences] [Google Scholar]
- Carlsson, M. 1986, Uppsala Astronomical Observatory Reports, 33 [Google Scholar]
- Castelli, F. 2005, MSAIS, 8, 25 [Google Scholar]
- Cayrel, R., Depagne, E., Spite, M., et al. 2004, A&A, 416, 1117 [NASA ADS] [CrossRef] [EDP Sciences] [Google Scholar]
- Chambers, K. C., & PS1 Science Consortium 2015, AAS, 225, #332.01 [Google Scholar]
- Chen, Y.-P., Trager, S. C., Peletier, R. F., et al. 2014, A&A, 565, A117 [NASA ADS] [CrossRef] [EDP Sciences] [Google Scholar]
- Dehnen, W., & Binney, J. J. 1998, MNRAS, 298, 387 [NASA ADS] [CrossRef] [Google Scholar]
- de Jong, J. T. A., Martin, N. F., Rix, H.-W., et al. 2010, ApJ, 710, 1664 [NASA ADS] [CrossRef] [Google Scholar]
- Diehl, H. T., Abbott, T. M. C., Annis, J., et al. 2014, SPIE, 9149 [Google Scholar]
- Djorgovski, S. 1995, ApJ, 438, L29 [NASA ADS] [CrossRef] [Google Scholar]
- Djorgovski, S., & Meylan, G. 1994, AJ, 108, 1292 [NASA ADS] [CrossRef] [Google Scholar]
- Goldoni, P. 2011, Astron. Nachr., 332, 227 [NASA ADS] [CrossRef] [Google Scholar]
- Guinouard, I., Horville, D., Puech, M., et al. 2006, Proc. SPIE, 6273, 116 [NASA ADS] [Google Scholar]
- Harris, W. E. 2010, ArXiv e-prints [arXiv:1012.3224] [Google Scholar]
- Henden, A., & Munari, U. 2014, Contributions of the Astronomical Observatory Skalnate Pleso, 43, 518 [Google Scholar]
- King, I. R. 1966, AJ, 71, 64 [Google Scholar]
- Korotin, S. A., & Mishenina, T. V. 1999, Astron. Rep., 43, 533 [NASA ADS] [Google Scholar]
- Korotin, S. A., Andrievsky, S. M., & Luck, R. E. 1999, A&A, 351, 168 [NASA ADS] [Google Scholar]
- Kučinskas, A., Dobrovolskas, V., & Bonifacio, P. 2014, A&A, 568, L4 [NASA ADS] [CrossRef] [EDP Sciences] [Google Scholar]
- Kurucz, R. L. 2005, Mem. Soc. Astron. It. Supp., 8, 14 [Google Scholar]
- Laevens, B. P. M., Martin, N. F., Sesar, B., et al. 2014, ApJ, 786, L3 [NASA ADS] [CrossRef] [Google Scholar]
- Mashonkina, L., Gehren, T., Shi, J.-R., Korn, A. J., Grupp, F., et al. 2011, A&A, 528, A87 [NASA ADS] [CrossRef] [EDP Sciences] [Google Scholar]
- McConnachie, A. W. 2012, AJ, 144, 4 [NASA ADS] [CrossRef] [Google Scholar]
- Momany, Y. 2015, A&SS Lib., 413, 129 [Google Scholar]
- Monaco, L., Bellazzini, M., Bonifacio, P., et al. 2005, A&A, 441, 141 [NASA ADS] [CrossRef] [EDP Sciences] [MathSciNet] [Google Scholar]
- Munari, U., Henden, A., Frigo, A., et al. 2014, AJ, 148, 81 [NASA ADS] [CrossRef] [Google Scholar]
- Salaris, M., Chieffi, A., & Straniero, O. 1993, ApJ, 414, 580 [NASA ADS] [CrossRef] [Google Scholar]
- Sbordone, L., Caffau, E., Bonifacio, P., & Duffau, S. 2014, A&A, 564, A109 [NASA ADS] [CrossRef] [EDP Sciences] [Google Scholar]
- Schlegel, D. J., Finkbeiner, D. P., & Davis, M. 1998, ApJ, 500, 525 [NASA ADS] [CrossRef] [Google Scholar]
- Schönebeck, F., Puzia, T. H., Pasquali, A., et al. 2014, A&A, 572, A13 [NASA ADS] [CrossRef] [EDP Sciences] [Google Scholar]
- Shanks, T., Belokurov, V., Chehade, B., et al. 2013, The Messenger, 154, 38 [NASA ADS] [Google Scholar]
- Spitzer, L. 1987, Dynamical evolution of globular clusters (Princeton: Princeton University Press), 191 [Google Scholar]
- Trager, S. C., Djorgovski, S., & King, I. R. 1993, Structure and Dynamics of Globular Clusters, 50, 347 [Google Scholar]
- Vernet, J., Dekker, H., D’Odorico, S., et al. 2011, A&A, 536, A105 [NASA ADS] [CrossRef] [EDP Sciences] [Google Scholar]
All Tables
Variations in stellar parameters for different assumptions on Teff, log g, and microturbulent velocity.
All Figures
|
Fig. 1 Colour−magnitude diagram in g and r bands of the Crater stars within 50.̋0 from the centre, based on the DES public images. The two target stars are identified as large green dots. Overplotted are shown two PARSEC isochrones for a 7 Gyr and a 2.2 Gyr old stellar population. A reddening correction of E(B−V) = 0.023, as deduced from the maps of Schlegel et al. (1998), has been applied to the isochrones. |
| In the text | |
|
Fig. 2 Portion of the X-Shooter normalised spectra of the two stars, R.I. is the residual intensity. The spectrum of Crater J113615-105244 has been displaced vertically by 0.5 for display purposes. Only lines that have been used in the abundance analysis are identified. |
| In the text | |
|
Fig. 3 Radial profile of Crater. The red squares are the raw counts of Crater stars selected along the stellar sequence; the filled circles represent the counts corrected for foreground contamination using the colour−magnitude diagram. The solid line is the best-fitting King model (King 1966), and the position of the tidal radius is indicated by a downward arrow. |
| In the text | |
|
Fig. 4 Colour image created from DES, g,r,i images showing the location of the two target stars. |
| In the text | |
|
Fig. 5 Updated version of Fig. 7 of de Jong et al. (2010). The radial velocity (lower panel), distance (middle panel), and sky position (upper panel) of Crater (shown as a star) compared to those of Leo IV (empty dot) and Leo V (filled dot). The lines are the orbits for Leo IV and Leo V, computed by de Jong et al. (2010), assuming common energy and angular momentum for the two galaxies, using Leo IV and Leo V (dotted line) as initial conditions, or their mean properties (dashed line), respectively. |
| In the text | |
Current usage metrics show cumulative count of Article Views (full-text article views including HTML views, PDF and ePub downloads, according to the available data) and Abstracts Views on Vision4Press platform.
Data correspond to usage on the plateform after 2015. The current usage metrics is available 48-96 hours after online publication and is updated daily on week days.
Initial download of the metrics may take a while.