Fig. 3
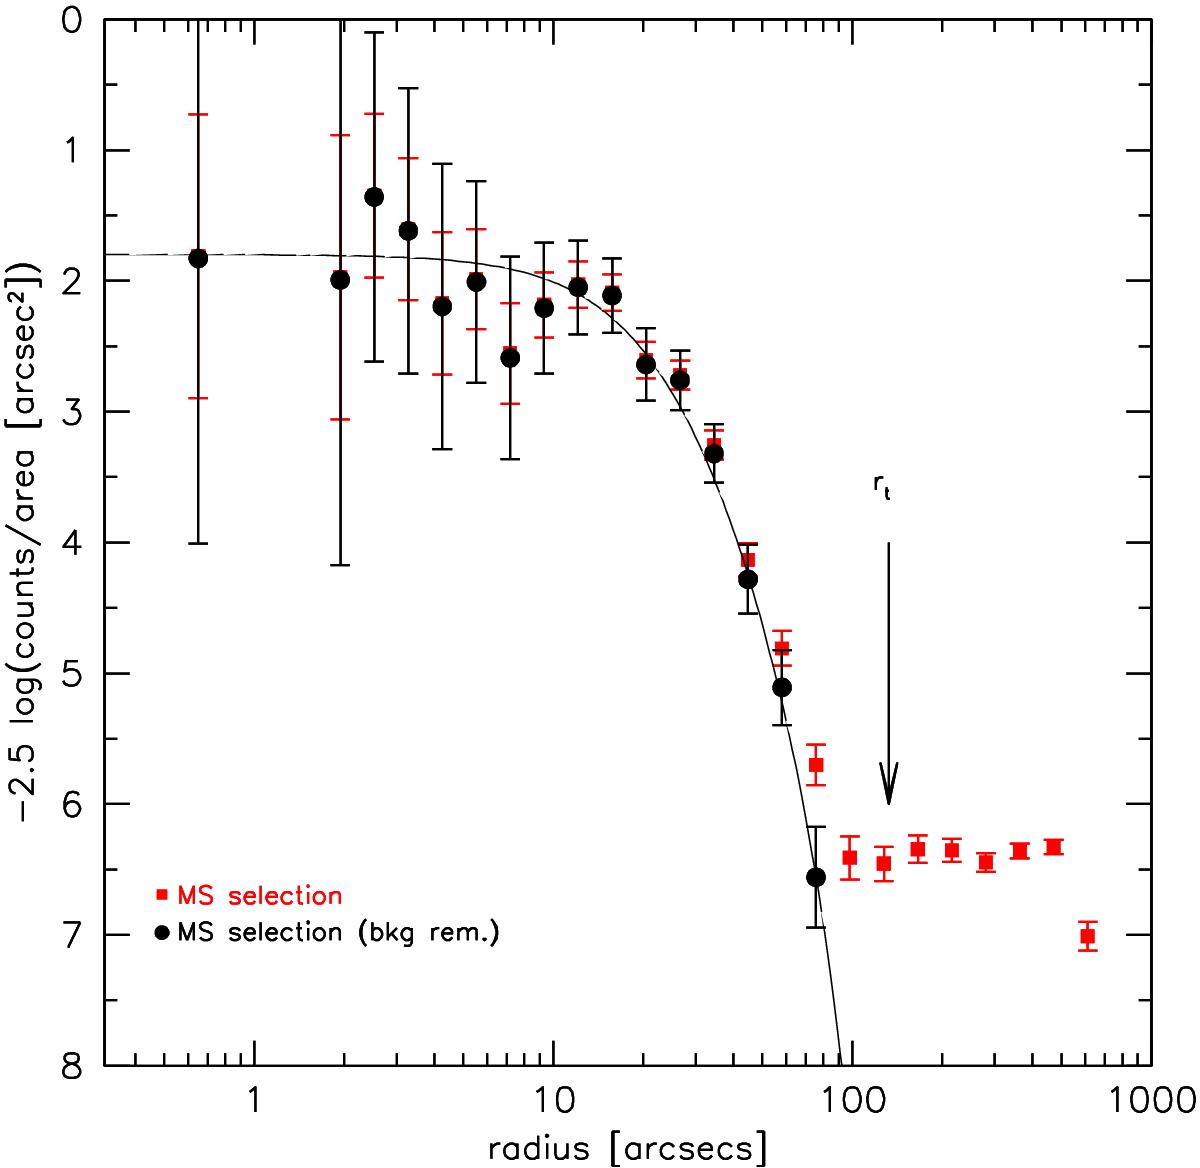
Radial profile of Crater. The red squares are the raw counts of Crater stars selected along the stellar sequence; the filled circles represent the counts corrected for foreground contamination using the colour−magnitude diagram. The solid line is the best-fitting King model (King 1966), and the position of the tidal radius is indicated by a downward arrow.
Current usage metrics show cumulative count of Article Views (full-text article views including HTML views, PDF and ePub downloads, according to the available data) and Abstracts Views on Vision4Press platform.
Data correspond to usage on the plateform after 2015. The current usage metrics is available 48-96 hours after online publication and is updated daily on week days.
Initial download of the metrics may take a while.