Fig. 1
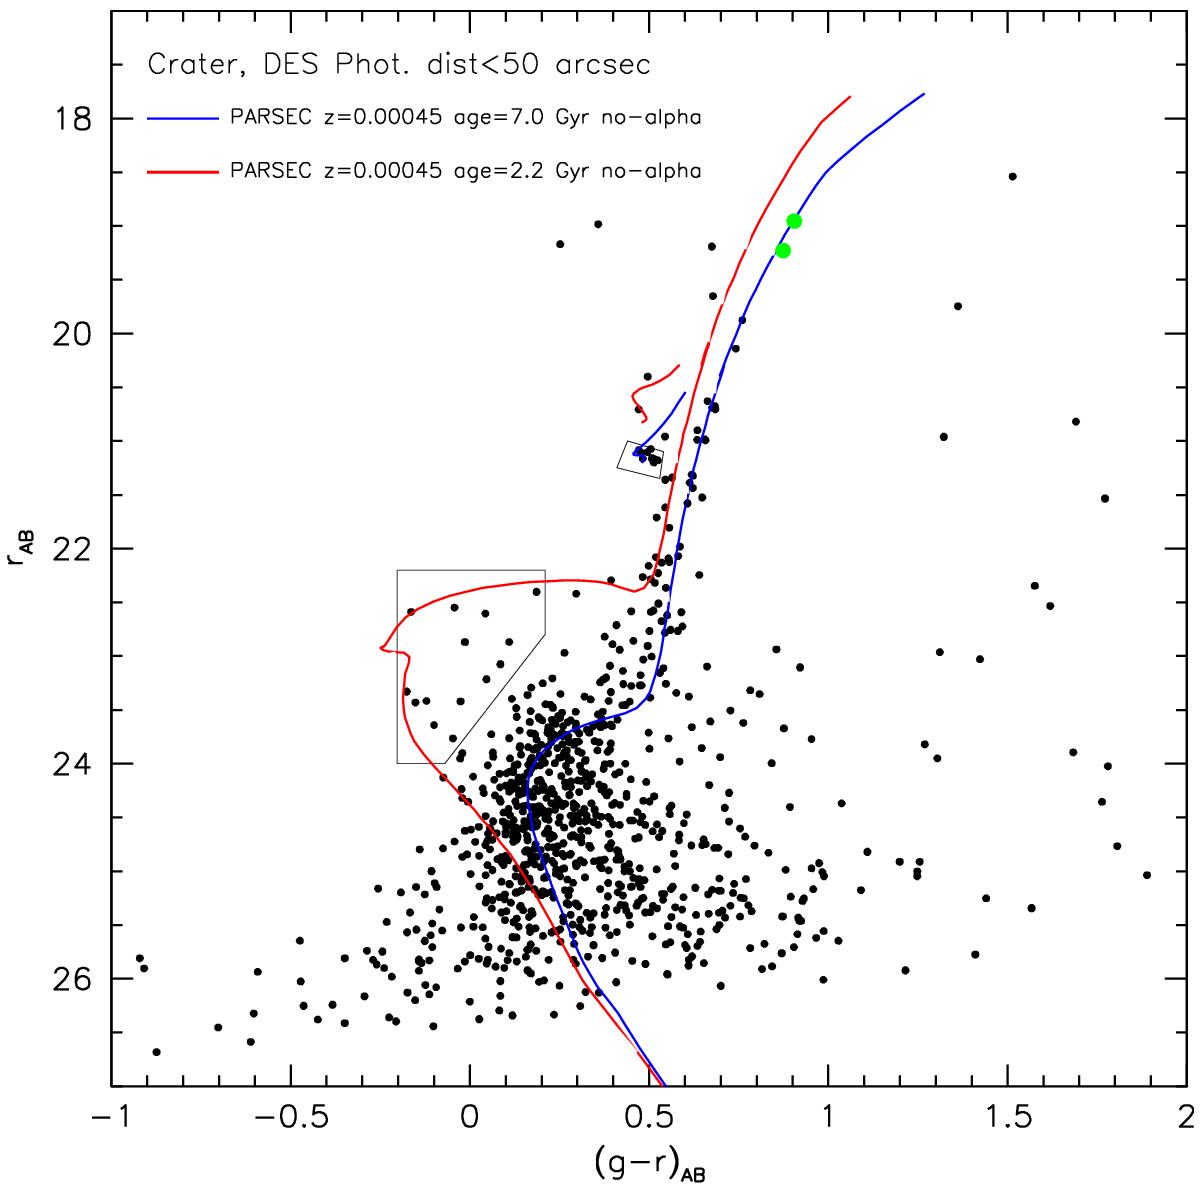
Colour−magnitude diagram in g and r bands of the Crater stars within 50.̋0 from the centre, based on the DES public images. The two target stars are identified as large green dots. Overplotted are shown two PARSEC isochrones for a 7 Gyr and a 2.2 Gyr old stellar population. A reddening correction of E(B−V) = 0.023, as deduced from the maps of Schlegel et al. (1998), has been applied to the isochrones.
Current usage metrics show cumulative count of Article Views (full-text article views including HTML views, PDF and ePub downloads, according to the available data) and Abstracts Views on Vision4Press platform.
Data correspond to usage on the plateform after 2015. The current usage metrics is available 48-96 hours after online publication and is updated daily on week days.
Initial download of the metrics may take a while.