| Issue |
A&A
Volume 579, July 2015
|
|
|---|---|---|
| Article Number | A41 | |
| Number of page(s) | 13 | |
| Section | Stellar atmospheres | |
| DOI | https://doi.org/10.1051/0004-6361/201526045 | |
| Published online | 23 June 2015 | |
Inhomogeneous cloud coverage through the Coulomb explosion of dust in substellar atmospheres
1 SUPA, School of Physics and Astronomy, University of St Andrews, St Andrews, KY16 9SS, UK
e-mail: craig.stark@st-andrews.ac.uk
2 SUPA, School of Physics and Astronomy, Kelvin Building, University of Glasgow, Glasgow, G12 8QQ, UK
Received: 6 March 2015
Accepted: 27 April 2015
Context. Recent observations of brown dwarf spectroscopic variability in the infrared infer the presence of patchy cloud cover.
Aims. This paper proposes a mechanism for producing inhomogeneous cloud coverage due to the depletion of cloud particles through the Coulomb explosion of dust in atmospheric plasma regions. Charged dust grains Coulomb-explode when the electrostatic stress of the grain exceeds its mechanical tensile stress, which results in grains below a critical radius a<acritCoul being broken up.
Methods. This work outlines the criteria required for the Coulomb explosion of dust clouds in substellar atmospheres, the effect on the dust particle size distribution function, and the resulting radiative properties of the atmospheric regions.
Results. Our results show that for an atmospheric plasma region with an electron temperature of Te = 10 eV (≈ 105 K), the critical grain radius varies from 10-7 to 10-4 cm, depending on the grains’ tensile strength. Higher critical radii up to 10-3 cm are attainable for higher electron temperatures. We find that the process produces a bimodal particle size distribution composed of stable nanoscale seed particles and dust particles with a ≥ acritCoul, with the intervening particle sizes defining a region devoid of dust. As a result, the dust population is depleted, and the clouds become optically thin in the wavelength range 0.1–10 μm, with a characteristic peak that shifts to higher wavelengths as more sub-micrometer particles are destroyed.
Conclusions. In an atmosphere populated with a distribution of plasma volumes, this will yield regions of contrasting radiative properties, thereby giving a source of inhomogeneous cloud coverage. The results presented here may also be relevant for dust in supernova remnants and protoplanetary disks.
Key words: stars: atmospheres / brown dwarfs / stars: low-mass / plasmas
© ESO, 2015
1. Introduction
A defining characteristic of brown dwarfs is that their atmospheres are cool enough that dust particles can condense and form large-scale cloud structures (Helling et al. 2004, 2008a,b; Dehn 2007; Helling & Woitke 2006; Witte et al. 2009, 2011; Tsuji 2002; Allard et al. 2001; Burrows et al. 1997; Marley et al. 2002; Morley et al. 2012). Cloud formation depletes the ambient gas and alters the objects’ resultant electromagnetic spectrum (e.g. see recent review by Helling & Casewell 2014). Observationally, the presence of clouds has been associated with photometric variability, which is believed to be caused by inhomogeneous cloud coverage (Bailer-Jones & Mundt 2001; Artigau et al. 2009; Radigan et al. 2012; Gillon et al. 2013; Girardin et al. 2013; Buenzli et al. 2014). However, such variability could also be connected to magnetic activity (Littlefair et al. 2008; Metchev et al. 2013), such as asymmetrically distributed, magnetically induced spots (Scholz & Eislöffel 2005). Recent observations of Luhman 16B’s infrared spectroscopic variability have allowed a two-dimensional map of the brown dwarf’s surface to be constructed. It reveals large-scale bright and dark features supporting the idea of patchy cloud cover (Crossfield et al. 2014). This cloud variability can be explained using a spot model where thick and thin cloud regions at different temperatures (indicating different atmospheric heights) provide the required inhomogeneity (Radigan et al. 2012; Apai et al. 2013; Burgasser et al. 2014; Morley et al. 2014). To quantify the inhomogeneity, recent observations have probed the horizontal and vertical structure of the atmosphere, identifying pressure-dependent phase variations that underlie the observed variability (Buenzli et al. 2012; Biller et al. 2013).
Inhomomgeneous cloud coverage may be significant with respect to the transition from L-type to T-type objects (e.g. see Burgasser et al. 2014). Ultracool L and T dwarfs bridge the divide between cool stars and giant gas planets, and understanding the transition from L-type dusty atmospheres to dust-free T-type atmospheres is a continuing problem (e.g. Tinney et al. 2003; Faherty et al. 2012; Dupuy & Liu 2012; Burgasser et al. 2014). In the latter case, the atmosphere may not be cloud free, but rather the clouds lie below the level where the atmosphere becomes optically thick. Differing models have been invoked to explain the transition, including cloud depletion due to changes in atmospheric chemistry (e.g. Knapp et al. 2004; Tsuji 2005; Burrows et al. 2006), the formation of holes in the cloud layers (e.g. Ackerman & Marley 2001; Burgasser et al. 2002; Gelino et al. 2002; Allard et al. 2013; Crossfield et al. 2014; Morley et al. 2014), and due to atmospheric circulation (Freytag et al. 2010; Showman & Kaspi 2013). Furthermore, a growing body of theoretical and observational evidence (e.g. Hallinan et al. 2008; Route & Wolszczan 2012; McLean et al. 2012; Osten et al. 2009; Antonova et al. 2013; Berger et al. 2009) suggests that ionization processes can be significant in these dusty environments producing extensive regions of plasma (Helling et al. 2011b, 2013; Bailey et al. 2014; Stark et al. 2013). This implies that substellar atmospheres could be composed of dusty gas-plasma mixtures, underlining the importance of atmospheric dusty plasma processes and their role in cloud evolution.
A plasma is defined as a quasineutral gas of charged and neutral particles which exhibit collective behaviour (Chen 1984). Locally, the entirety of the gas does not need to be ionized for it to behave as a plasma. As long as the collective, long-range electromagnetic influence of the many distant charged particles dominates over short-range, binary interactions the gas only needs to be weakly ionized (i.e. partially ionized, fe ≳ 10-7) for it to exhibit plasma behaviour (Diver 2013; Fridman 2008). In substellar atmospheres, Alfvén ionization can produce localized volumes of plasma with degrees of ionization, fe, ranging from 10-6 to as large as 1, depending on the atomic and molecular species that is ionized (Stark et al. 2013). Alfvén ionization occurs when a stream of neutral gas (that reaches a critical threshold speed) impinges on a low-density magnetized plasma. The inflowing neutrals scatter the plasma ions, leaving behind a significant charge imbalance of electrons that are accelerated by their collective self-repulsion to ionising energies (Alfvén 1960; Diver et al. 2005). In principle, the volumes of atmospheric plasma created can range from small to large scales, potentially populating a significant fraction of the atmosphere.
Helling et al. (2011a) investigated the effect of dust-induced collisional ionization in substellar atmospheres using Drift-Phoenix model atmosphere results. In this process, if the energy imparted from one dust grain to another during a collision exceeds the grain’s work function, an electron will be liberated. Turbulence-induced dust-dust collisions were found to be the most efficient dust-dust collisional ionization process that could enhance the local degree of ionization, but on its own it was insufficient to form a plasma. The degree of ionization can be further enhanced by atmospheric electrical discharge events (Helling et al. 2011b, 2013; Bailey et al. 2014; MacLachlan et al. 2009, 2013): an ensemble of inter-grain discharges, in analogy to laboratory microdischarges (Becker et al. 2006), or large-scale cloud lightning will greatly increase the electron number density. Furthermore, the bombardment of the atmosphere by cosmic rays (Rimmer & Helling 2013) will also contribute to the formation of atmospheric plasmas.
The properties of the produced plasma, such as the electron and ion temperature, will depend on the ionization process which created it. Due to their significantly lower mass relative to the neutrals and ions, the plasma electrons only lose a small fraction of their energy following a collision. As a result, the electrons and the heavier species will not necessarily be in thermal equilibrium and can have differing temperatures. In typical terrestrial discharges Te>Tgas ≈ Ti, where Ti is the ion temperature and electron temperatures are Te ≈ 1 − 100 eV (≈ 104 − 106 K) (Fridman 2008; Diver 2013). In substellar atmospheres electrons from thermal ionization are in thermal equilibrium with the ambient neutral gas (Te ≈ Tgas) and have electron temperatures of  eV) (
eV) ( K)).
K)).
Contemporary atmospheric models of brown dwarf and exoplanetary (substellar) atmospheres do not exploit collective plasma processes (such as dust growth via plasma deposition) and how these effects fit into a global understanding of cloud formation and other atmospheric phenomena (such as large-scale flows). A major challenge is to model cloud formation and its consequent effect on the surrounding environment, involving plasma processes such as non-spherical dust growth (Stark et al. 2006) and electrical discharge events (MacLachlan et al. 2013). Opik (1956) investigated the electrostatic disruption (or Coulomb explosion) of dust grains, where the electrostatic stress of a body holding a net charge exceeds its mechanical tensile strength (the maximum stress or pressure that a material can withstand while being pulled), resulting in it fracturing. See also Rhee (1976), Hill & Mendis (1981), Fomenkova & Mendis (1992), Rosenberg & Mendis (1992), Gronkowski (2009), among others.
In this paper we outline a model to contribute to the understanding of inhomogeneous cloud coverage in substellar atmospheres via the Coulomb explosion of cloud dust particles. Consider an atmosphere with plasma regions populated with dust cloud particles. The spatial extent and distribution of the plasma regions will depend upon the ionization process that produced them and environmental factors. For example, inhibited plasma transport perpendicular to the ambient magnetic field can result in anisotropically shaped plasma regions, structured by the field geometry. In a dusty atmosphere, cloud particles may grow in the plasma environments themselves, grow in the region prior to plasma generation, or have migrated into the region via gravitational settling, wind flows or another transport mechanism. As the dust charges, the accumulated electrostatic stress on the particles may overcome their mechanical tensile strength resulting in them breaking up and being destroyed. Electrostatic disruption preferentially affects smaller grain sizes and this may have an effect on the particle size distribution function affecting the thickness and the electromagnetic properties of the cloud. Depending on the distribution of the dusty plasma regions on the substellar surface, the electrostatic disruption of dust clouds could yield regions of contrasting cloud properties, thereby giving a source of inhomogeneous cloud coverage that could be associated with the observed spectroscopic variability.
The aim of this paper is to investigate the conditions under which the electrostatic disruption of cloud dust particles occur in brown dwarf or gas giant planet atmospheres and to assess the contribution of Coulomb explosions to spectroscopic variability. To do so we will use an example atmosphere from the Drift-Phoenix model atmosphere grid characterized by log g = 3.0, Teff = 1600 K. This paper is structured as follows: in Sect. 2 we discuss contemporary substellar atmosphere and cloud formation models, specifically the Drift-Phoenix model; in Sect. 3 the concept of dust in plasmas and grain charging is introduced. Moreover, we consider the most appropriate plasma sheath model required to describe the charging of the dust and the region surrounding the dust grain; Sect. 4 formulates the electrostatic disruption criteria of spherical dust grains in substellar atmospheres using the Drift-Phoenix model atmosphere discussed in Sect. 2. It investigates the effect electrostatic disruption has on the dust particle size distribution, compares the timescale for disruption to dust growth timescales and discusses the observational consequences of Coulomb explosions; Sect. 5 summarizes our findings and discusses the impact of the electrostatic disruption of dust on the subsequent chemistry that occurs in substellar atmospheres. Note that unless otherwise stated, the equations in this paper are in SI units.
2. Substellar model atmospheres
The Drift-Phoenix model atmosphere code (Helling et al. 2004, 2008a,b; Dehn 2007; Helling & Woitke 2006; Witte et al. 2009, 2011) is a 1D phase-non-equilibrium model, that describes the formation of dust and clouds in a self-consistently calculated atmosphere. Drift-Phoenix model atmospheres incorporate radiative transfer, convective energy transport, chemical equilibrium, hydrostatic equilibrium (Hauschildt & Baron 1999) and dust cloud formation (Woitke & Helling 2003, 2004). The cloud model numerically solves a system of differential equations that describe the time-dependent dust formation process, where seeds form (TiO2) from a highly supersaturated gas. Once the initial seed particles have formed, further growth proceeds via surface chemical reactions growing a grain mantle. The Drift-Phoenix model atmospheres consider 32 surface reactions and is restricted to seven participating solids: TiO2[s], Al2O3[s], Fe[s], SiO2[s], MgO[s], MgSiO3[s] and Mg2SiO4[s]. Drift-Phoenix solves the dust moment and element conservation equations, returning the parameterized particle size distribution function f(a,z) of grain radius a at atmospheric height z; and the chemical composition of the dust expressed in volume fractions Vs/Vtot, for all solids s involved where Vtot is the total dust volume.
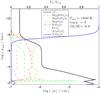 |
Fig. 1 Volume fraction Vs/Vtot and the mean grain size ⟨ a ⟩ of a mineral cloud in a substellar atmosphere with Teff = 1600 K and log g = 3. Results are from the Drift-Phoenix model atmosphere simulation and is consistent with Helling et al. (2008b). |
In this paper we are interested in the electrostatic disruption of dust grains in substellar atmospheres. We consider a representative model atmosphere characterized by log g = 3.0, Teff = 1600 K, applying results from the Drift-Phoenix model atmosphere simulations. We are particularly interested in the chemical composition of the dust particles (hence the material volume fractions) and their size distribution since this informs of their mechanical properties and the particle sizes affected. For this model atmosphere Fig. 1 shows the dust volume fraction Vs/Vtot and the mean grain size ⟨ a ⟩ as a function of atmospheric gas pressure pgas. The nucleation-dominated upper cloud deck (pgas ≈ 10-11 bar) predominantly contains small grains (⟨ a ⟩ ≈ 10-7 cm) composed of TiO2[s], whereas the lower atmosphere (pgas ≈ 10-2 bar) is mainly made up of large dust grains (⟨ a ⟩ ≈ 10-5 cm) composed of multiple species including Al2O[s], Fe[s], Mg2SiO4[s] and trace amounts of other solid materials. At mid-atmospheric pressures (pgas ≈ 10-6 bar) the mean grain size is ⟨ a ⟩ ≈ 10-6 cm and the grain composition is more mixed being composed mainly of MgSiO3[s], MgSiO4[s], SiO2[s], Fe[s] and MgO[s].
3. Dust cloud particles in substellar plasmas
In this section we discuss the charging and the behaviour of dust immersed in a substellar atmospheric plasma region and consider the appropriate model required to best describe the plasma sheath of the dust.
3.1. Dust charging in plasmas
Consider a dust particle submerged in an electron-ion plasma. We will assume that the particle currents drawn from such a plasma are the only contributors to the grain charge and we ignore other charging processes such as photoionization and secondary electron emission. This assumption is valid in the absence of significant UV radiation, which would liberate the electrons from the surface of the grain, possibly leading to positively charged grains (Shukla 2001). Due to the greater mobility of the electrons relative to the ions, the dust becomes negatively charged initiating the formation of a plasma sheath (an electron depleted region) around the grain. As the negative charge on the grain builds up, the number of electrons having the appropriate kinetic energy to overcome the grain potential, striking its surface, decreases. Ions are subsequently accelerated from the bulk plasma, through the sheath and are ultimately deposited on the grain surface altering its shape, size, mass, charge and hence the potential of the grain. As a result the number of electrons reaching the surface increases further altering the surface charge. This occurs until the grain reaches an equilibrium state where the flux of electrons and ions at the grain surface is equal. At this point the grain reaches the floating potential φf and the sheath length is of the order of the plasma Debye length λD = (ϵ0kBTe/ (nee2))1/2. The Debye length is the spatial length scale at which exposed charge is screened by the plasma. In this particle-flux equilibrium state we have a negatively charged grain that is screened by the bulk plasma such that on length scales greater than the Debye length, the electric field from the grain is zero. The spatial extent of the sheath (the sheath length, dsh) occurs where the electric potential energy of the electrons is approximately equal to their thermal energy and the electric field from the grain is largely shielded from the rest of the bulk plasma.
For conducting grains the captured charge will distribute itself on the surface in the lowest energy configuration such that the electric field inside the conductor is zero, otherwise charges see a net force and move seeking equilibrium. For spherical dust grains this leads to the uniform distribution of electric charge on the grain surface and the electric field can be simply described. However, in ultra-cool substellar atmospheres dust grains are insulating and so once the electrons strike the surface their transport is inhibited and they can not easily reach the lowest energy configuration. However, in a plasma the dust grains will be constantly bombarded by an isotropic flux of electrons and ions which allows the lowest energy configuration to be obtained even though electron transport in the dust grain is inhibited. For spherical dust, the electric field from the grain will be the same as that from an equivalent conducting grain allowing the same formulae to be used to describe its electric field.
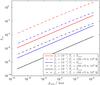 |
Fig. 2 Ratio of the sheath extent to the ion-neutral mean free path δni = dsh/λmfp,n as a function of atmospheric gas pressure pgas for the same model atmosphere as in Fig. 1. δni is plotted for degrees of ionization fe = 10-7, 10-4 and 10-1 and electron temperatures Te = Tgas ( |
3.2. Collisions in plasma sheaths
The effect of collisions in the plasma sheath defines how the sheath will behave and how it should be described. In this section the significance of collisions in the sheath is quantified. The plasma sheath surrounding a dust particle is considered collisionless if the collisional length scale (the mean free path, λmfp,n) for ions with the neutral species is greater than the sheath extent, dsh: δ = dsh/λmfp,n< 1; otherwise, the sheath is collisional (Lieberman & Lichtenberg 2005). In other words, if the ions do not participate in neutral collisions while transiting the sheath then δ< 1; if the ions experience multiple collisions then δ> 1. In the case δ< 1 the effect of short-range binary collisions is negligible in comparison to long-range collective phenomena and the sheath is well described by solutions to the Vlasov equation (Bouchoule 1999). If the collisional scale length for ions is less than the sheath length then a collisional model describing the sheath is preferable. Assuming that the sheath length is approximately equal to the Debye length, dsh ≈ λD and λmfp,n = (nnσn)-1, we can write, 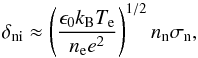 (1)where ne is the plasma electron number density, nn is the neutral species number density and σn is the corresponding collisional cross-sectional area. Note that in Drift-Phoenix, ngas refers to the number density of all species and nn refers to the number density of the neutral species only, such that ngas = nn + ne + ni = nn + 2ne. Thus, the degree of ionization takes the following form, fe = ne/ (nn + ne) = ne/ (ngas − ne). For ion-neutral interactions, we assume
  where rn ≈ 10-8 cm is the radius of a neutral species; therefore,
 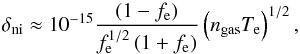 (2)where ngas is in units of [cm-3]. The ratio of the sheath length and the ion-neutral mean free path, δni, (Eq. (2)) is plotted in Fig. 2 as a function of atmospheric gas pressure, pgas, for an example substellar atmosphere characterized by log g = 3 and Teff = 1600 K (see Sect. 2). Note that the atmospheric gas pressure pgas, in this plot and in subsequent plots, acts as a proxy for atmospheric height and in general does not reflect the true local atmospheric gas pressure. This is a result of varying the degree of ionization from the values calculated in Drift-Phoenix due to thermal ionization, to reflect additional non-thermal ionization processes that occur. As a consequence the local atmospheric gas pressure would change and deviate from its original Drift-Phoenix calculated value. Further to this, note that for fe = 1, δni = 0 since nn → 0 and λmfp,n → ∞. For low degrees of ionization (fe ≈ 10-7) the neutrals will be the majority species and the transport of the plasma ions will be inhibited by frequent collisions with the neutrals as they travel through the partially ionized medium. If the degree of ionization increases and more of the gas is ionized, the neutral number density decreases and the likelihood of an ion-neutral interaction is smaller relative to the previous case. In the case of a fully ionized region of plasma (fe = 1) there will be no neutrals for the ions to interact with and the sheath will be collisionless. For atmospheric gas pressures pgas ≈ 10-12 − 10-4 bar in the model considered, the collisionless sheath criterion is satisfied, δni< 1, for all cases of fe and Te that characterize the plasma regions in the atmosphere. At higher atmospheric gas pressures (pgas ≳ 10-3 bar) only plasmas with degrees of ionization fe ≳ 10-4 satisfy δni< 1. In plasma regions where δni> 1, the sheaths are more accurately described by collisional models; however, δni> 1 is only obtained for pgas ≳ 10-3 bar, which is a very small fraction of the atmosphere; hence, we are justified assuming a collisionless sheath.
3.3. OML and Bohm theory
Following Sect. 3.2, if we assume a collisionless sheath and a dust particle of radius a, the parameter ξ = a/dsh defines the plasma sheath regime and the appropriate theory required to describe it: Bohm or orbital motion limited (OML) theory (Allen et al. 1957). Bohm theory (ξ ≫ 1) assumes that all ions that enter the sheath reach the dust surface and contribute to its charge, whereas OML theory (ξ ≪ 1) takes into account that some ions may be deflected and fail to reach the particle surface. Assuming for the sheath length that dsh ≈ λD we have,  where in the final expression ngas is in units of [cm-3] and a is in units of [cm]. For ξ ≫ 1 the sheath extent is much smaller relative to the particle size and so the surface area of the dust particle is effectively the same as the sheath surface area. In this regime, all ions that are accelerated from the bulk plasma and through the sheath reach the particle’s surface contributing to its charge and potential. For ξ ≫ 1 the sheath is called a Bohm sheath and the floating potential is given by (Bouchoule 1999),
  (5)Calculating the floating potential using Bohm theory gives an upper limit to the actual potential value. In the regime ξ ≪ 1 the sheath length is much greater than the particle size. In this scenario, it is more likely that ions entering the sheath with a random velocity component may not collide with the particle surface since its surface area is much smaller than the sheath’s. Instead, ions will have non-zero angular momentum and may participate in stable orbits around the dust particle or be ejected from the sheath on parabolic orbits. In this case the floating potential, φf is reduced and is calculated using OML theory and is given by the expression (Bouchoule 1999),
  (6)It is important to note that the floating potential in both cases depends on the bulk properties of the plasma. The parameter ξ = a/dsh (Eq. (4)) is plotted in Fig. 3. Predominantly ξ< 1 indicating that OML theory is best suited to describing plasma sheaths in substellar atmospheres. Since the neutral number density increases with atmospheric gas pressure pgas, the electron number density also increases with pgas for a given degree of ionization. As a result, the Debye length decreases with increasing electron number density and ξ increases in value as the atmospheric pressure increases. Holding the electron number density fixed, increasing (decreasing) the electron temperature has the effect of increasing (decreasing) the Debye length and decreasing (increasing) ξ.
There is no universal consensus on the dynamical theory of ions in plasma sheaths and the resulting effect on dust charging in plasmas; therefore, we present results from both Bohm and OML theory in order to give a pragmatic representation. Bohm theory gives a valuable upper limit to the floating potential whereas OML represents an indication of how the non-zero angular momentum of ions in the sheath affect the charging of the dust particle. For the results presented here, the difference in the floating potentials calculated using the Bohm and OML is never more than a factor ≈2.
4. Inhomogenous cloud coverage through the Coulomb explosion of dust clouds
This section calculates the criteria for charged dust grains to Coulomb explode and the effect this has on the resultant cloud particle size distribution function in substellar atmospheres.
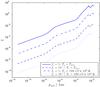 |
Fig. 3 Ratio of the dust grain radius to the sheath extent ξ = a/dsh as a function of atmospheric gas pressure pgas for the same model atmosphere as in Fig. 1. ξ is plotted for a = ⟨ a ⟩, for degrees of ionization fe = 10-7 and 1 and electron temperatures Te = Tgas ( |
4.1. Criteria for electrostatic disruption of spherical dust grains
Dust immersed in a plasma becomes negatively charged through the collection of plasma electrons. During the charging process described in Sect. 3 the dust can be electrostatically disrupted if the resultant electrostatic stress acting on the dust grain (due to the captured electrons) overcomes the mechanical tensile strength (the maximum stress that a material can withstand while being pulled) of the particle, breaking it apart. Consider a conducting spherical dust grain of radius a with a uniform tensile strength Σ (measured in Pascals, Pa). Electrostatic disruption occurs when the electrostatic stress (ϵ0E2/ 2) on the grain exceeds its tensile strength (Opik 1956),  (7)therefore, using Q = Ne,
  (8)This expression states that there is a maximum number of net charges that can reside on the surface of a spherical dust grain of radius a without it breaking up. Equivalently, this expression can be stated in terms of the surface charge density σ ≥ (2ϵ0Σ)1/2, which is independent of the grain size. For the critical charge density σc, grains with a smaller surface area can only tolerate a smaller number of charges in comparison to larger grains. Therefore, in a plasma where spherical dust particles are charged to the floating potential φf (=Ea), the result can be recast in terms of the critical cloud particle size,
  , below which the dust particles are electrostatically disrupted,
  (9)hence,
  (10)Therefore, dust particles that are charged and have a size below
  will Coulomb explode and be broken up. For multi-composite materials (as expected for cloud particles in substellar atmospheres) the Rule of Mixtures (RoM) can be used to approximate the resultant tensile strength Σ of a hybrid material:
  (11)where Vs/Vtot and Σs are the volume fraction and tensile strength of the sth material of the composite (Callister 1985; Torquato et al. 1999; Hsieh & Tuan 2005; Kim et al. 2001; Li et al. 1999; Torquato 2000; Raabe & Hangen 1995). The RoM can be used to approximate properties of composite materials such as the elastic modulus. Additional physical effects can be incorporated into the RoM formulation such as interfacial bonding between the composite materials; and the effect of particle size distributions and particle clustering within the composite (Li et al. 2001). To quantify the effect of imperfect bonding between the individual components and the departure from perfectly formed idealized crystalline solids the parameter mb ∈ (0,1] is introduced.
Tensile strengths of selected materials.
Using the values of tensile strengths listed in Table 1 and the Drift-Phoenix volume fractions Vs (Fig. 1), Fig. 4 shows the critical cloud particle size, , calculated using Eq. (10) and using the tensile strength, Σ, from Eq. (11). The critical cloud particulate size is plotted as a function of local gas pressure pgas for electron temperatures ranging from 1 to 100 eV. The top, middle and bottom subplots show  for mb = 1, 10-2 and 10-4 respectively. For mb = 10-4, electron temperatures Te = Tgas ( K), green) are considered but are not considered for the cases mb = 1 and 10-2, since the critical particle sizes are too small and are unphysical.
The critical particle size is dependent upon the floating potential and the tensile strength of the dust cloud particle,  . For both sheath models (Bohm and OML) the floating potential depends upon the electron temperature, Te. As Te increases the plasma electrons become more energetic and so a greater number of electrons can reach the surface of the grain, overcoming the electrostatic potential and increasing the ultimate potential reached when the particle-flux equilibrium configuration is achieved. For the Bohm model the floating potential (and hence ) has a simple linear dependence upon Te and so an increase in Te is reflected in φf and .
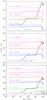 |
Fig. 4
|
For example when mb = 1, at pgas ≈ 10-4 bar the critical particle radius varies from  cm when Te = 1 eV (≈ 104 K) to
  cm when Te = 10 eV (≈ 105 K). Similarly the critical radius increases to
  cm when Te = 100 eV (≈ 106 K). In comparison to the Bohm model, the floating potential and hence calculated with OML theory is smaller for a given Te; however, the difference in for the two models is never more than a factor ≈ 2.
For a given electron temperature, the variation of with pgas is predominantly determined by the variation in the total tensile strength of the dust particles, Σ, hence the volume fraction Vs/Vtot and individual tensile strengths of the constituent materials. As an example to elucidate this point, we look at the values of for mb = 1 and the Te = 10 eV (≈ 105 K), Bohm theory solution (red-dash) in Fig. 4. At the bottom of the atmosphere (pgas ≈ 10-2 bar), Fig. 1 shows that Al2O3[s] is the dominant dust component (Vs/Vtot ≈ 1) which has a relatively high tensile strength (241.4 MPa) and this raises the overall mechanical tolerance of the dust. As a result, the critical particle radius (∝ Σ− 1/2) has a relative low value, cm. However, as we climb through the cloud (pgas ≈ 10-4 bar) the volume fraction of Al2O3[s] decreases drastically and other materials, such as MgSiO3[s], that have a significantly lower tensile strength (9.6 MPa) dominate the mechanical properties of the grains, therefore lowering the electrostatic stress that can be mechanically tolerated. As a consequence increases in value from that at higher atmospheric pressures to  cm. Finally, at the top of the cloud the grains are predominately composed of TiO2[s], which has a tensile strength similar to magnesium silicates (36.41 MPa) and so the critical particle size is similar in value cm.
The material tensile strengths used (Table 1) are obtained from material science, where they are obtained under optimum laboratory conditions using idealized samples and present an upper bound to their actual value. In reality the tensile strengths of the dust particles will be much lower reflecting the imperfect bonding and structure of the particles. Although the dust particles could be crystalline in nature (see Helling & Rietmeijer 2009) the possibility exists that they are not and are only a loose aggregate of weakly bonded material. The tensile strength is the macroscopic quantity that represents the effect of the microscopic bonds holding the atoms of the solid together. An estimation of the tensile strength of a dust grain can be made by considering the work done, W, by the bonds to maintain a stable solid structure: Σ ≈ W/Vd, where Vd = 4πa3/ 3 is the volume of the dust grain. If a solid is held together by Nb bonds of energy Eb, then W ≈ EbNb. The number of bonds can be estimated by calculating the number of participating atoms of radius r0 in a cross-sectional slice through the dust grain of area πa2; hence, Nb ≈ (a/r0)2, where r0 ≈ 10-8 cm is the classical radius of an atom. Therefore, the tensile strength of the dust grain can be estimated as Σ ≈ (a/r0)2Eb/ (4πa3/ 3). For a crystalline spherical dust grain of radius a ≈ 10-4 cm and typical lattice energy Eb ≈ 10 eV, the estimated tensile strength is Σ ≈ 10 MPa, which is consistent with the tensile strengths listed in Table 1. However, for a similarly sized dust grain that is weakly bonded, held together by van der Waals bonds (Eb ≈ 0.01 eV), where only 1% of the atoms participate in bonding, the tensile strength can be as low as Σ ≈ 10-4 MPa. Therefore, in comparison to the typical tensile strengths in Table 1,  MPa), the parameter mb can be as low as 10-4.
The effect of imperfect bonding is demonstrated in Fig. 4, for values of mb = 10-2 (middle subplot) and 10-4 (bottom subplot). Consider calculated for Te = 10 eV (≈ 105 K) using Bohm theory, at pgas ≈ 10-4 bar, assuming a perfectly bonded crystalline dust particle (mb = 1),  cm. For mb = 10-2 this value of the critical dust radius increases by a factor
  to become
  cm. Similarly, for mb = 10-4, increases by a factor of ≈ 100 such that
  cm. For a Te = 100 eV plasma the critical particle radius can be as large as
  cm when mb = 10-4.
Charged dust grains with a radius below the critical radius , will be disrupted and broken up, leaving a population of dust grains with  . In addition, there will be a further population of crystalline seed particles composed of a single substance (e.g. TiO2, Fe, Al2O3, etc.) with a stable radius,
  , where mb = 1. For example, pure crystalline seed particles composed of TiO2 (Σ = 36.21 MPa) immersed in a plasma with Te = 1 eV (≈ 104 K) will have a minimum critical radius aseed ≈ 10-7 cm. Consider an aggregate of crystalline seed particles forming a spherical particle cluster. In this context the parameter mb is no longer unity and contains a number of additional effects, such as the packing efficiency of arranging constituent particles into a desired volume. For simple cubic, body-centred cubic and face-centred cubic stacking geometries the packing fraction is fp ≈ 0.52, 0.68 and 0.74, respectively. The packing fraction sets an upper limit to the value of mb. Assuming that the aggregate’s tensile strength reflects that of the crystalline seed particles, the ratio of the tensile strengths for the two cases is 1 /mb and the ratio of the critical radius is
  . Therefore, if the particle aggregate’s radius is smaller than
  , the aggregate is unstable to electrostatic disruption and the unstable range is defined by
 ![\hbox{$] a_{\rm seed},a_{\rm seed}/\!\!\sqrt{m_{\rm b}}]$}](/articles/aa/full_html/2015/07/aa26045-15/aa26045-15-eq164.png) . However, the tensile strength of the aggregate may be lower than that of the constituent seed particles since they may be bonded together via van der Waals interactions. For example, consider a particle aggregate of radius 10-5 cm composed of 10-7 cm seed particles bonded together via van der Waals interactions (≈ 0.01 eV), the tensile strength of the aggregate can be 10-3 MPa. In this scenario the ratio of tensile strengths will be smaller, resulting in a greater critical radius for stability and a larger region of instability.
. However, the tensile strength of the aggregate may be lower than that of the constituent seed particles since they may be bonded together via van der Waals interactions. For example, consider a particle aggregate of radius 10-5 cm composed of 10-7 cm seed particles bonded together via van der Waals interactions (≈ 0.01 eV), the tensile strength of the aggregate can be 10-3 MPa. In this scenario the ratio of tensile strengths will be smaller, resulting in a greater critical radius for stability and a larger region of instability.
The seed particles that compose the particle aggregate are initially charged to the floating potential φf = Qseed/ (4πϵ0aseed), where Qseed is the charge on a seed particle. The resulting particle aggregate will also be charged to the floating potential such that φf = Qagg/ (4πϵ0aagg), where Qagg and aagg is the charge and radius of the particle aggregate respectively. Therefore, the charge ratio is Qagg/Qseed = aagg/aseed. The total charge of the aggregate can also be calculated by summing the charge from the individual seed particles. The number of seed particles in the aggregate, Nseed, is given by the volume occupied by the seed particles in the aggregate, Vaggfp, divided by the volume of a seed particle, Vseed; therefore, Nseed = (aagg/aseed)3fp. The total charge of the aggregate is Qtot = (aagg/aseed)3fpQseed, which is greater than the aggregate charge calculated from the floating potential, Qtot>Qagg. The process of particle aggregation results in charge being lost by the aggregate back into the plasma.
However, this analysis assumes only surface charges; if the particle aggregate has a volumetric charge distribution, the electric field will be non-zero inside the aggregate and the constituent charged seed particles will see a non-zero electrostatic force. This will undermine the mechanical stability of the aggregate and will reduce the value of mb further. This is in contrast to a conducting dust grain, where the electric charge will distribute itself on the surface such that the electric field inside is zero and the electric potential is constant. The surface area of the aggregate,  , is less than the total available surface area, Nseed4πaseed. Assuming that each seed particle is identically charged, the charge on the surface of the aggregate is given by Qsurf = aseedQagg/ (aaggfp) and the internal charge by Qint = Qagg − Qsurf. For example, assuming aseed = 10-7 cm, aagg = 10-5 cm and fp ≈ 0.5, the surface charge is Qsurf ≈ 10-2Qagg. Therefore, the majority of the electric charge is held within the body of the aggregate. Let us consider that the net electric charge is distributed uniformly throughout the volume of the aggregate so that the electric field as a function of radius, r, inside the aggregate is
  . Comparing the surface electric field and the internal electric field of the aggregate yields E/Esurf = r/aagg. This allows a comparison of the relative strength of the internal electric field. Note that in the case of a conducting dust grain the internal electric field is zero. On length scales comparable to the seed particle size, E/Esurf = aseed/aagg ≈ 10-2 for aseed = 10-7 cm and aagg = 10-5 cm. Therefore, a porous dust aggregate will have a repulsive, non-zero electrostatic energy density that weakens its mechanical integrity. The analysis of dust grains collected from the Jupiter-family comet 67P/Churyumov-Gerasimenko shows the dust particles are fluffy, porous aggregates with very low tensile strengths of the order of 103 Pa (Schulz et al. 2015). This supports the tensile strength values considered in this paper and that the dust grains may be a loose, porous, fluffy aggregate of weakly bonded material.
Therefore, in a dusty plasma region there exists an instability strip for particle sizes between seed particles and particle aggregates composed of multiple seed particles, defined by . In order for stable grains with a radius greater than to form they cannot do so through aggregation nor thin film surface growth via neutral gas-phase surface deposition. The accretion of unstable fragments that produce a bigger stable particle could occur as long as the accretion timescale is shorter than the timescale for the fragment to Coulomb explode. If the plasma is only present in certain regions of the atmosphere, dust growth can occur classically and can be transported into the plasma region, whereupon the unstable particles will Coulomb explode upon charging to reach the floating potential.
Electron field emission occurs when a dust grain’s surface electric field becomes large enough that electrons are liberated from its surface. If significant, the resulting current must be taken into account to determine the grain’s net charge from the steady-state balance of currents to its surface. For dust grains, electron field emission becomes a significant process when a critical electric field strength at the grain’s surface is reached Efe = φ/a ≳ 107 V cm-1 (Gomer 1961; Axford & Mendis 1974; Draine & Salpeter 1979; Ishihara 2007; Mann et al. 2014), where φ is the grain potential and a is the radius of the dust grain. This value is calculated from the Fowler-Nordheim equation, which determines the electron current drawn from a conducting dust grain with a work function, Wf (typically Wf = 1 − 5 eV). Assuming φ/a = 107 V cm-1, field emission is not a significant grain charging process if a ≳ 10-7φ. In a Te = 1 eV plasma,  V) and so dust grains with a ≳ 10-7 cm are not significantly affected by field emission, likewise a ≳ 10-6 cm and a ≳ 10-5 cm for plasmas with Te = 10 eV (
 V)) and 100 eV (
 V)) respectively. Only for the smallest dust grains in a Te = 100 eV plasma is field emission a significant contributor to dust charging and so inhibit the attainment of for electrostatic disruption. For this grain population, the potential they acquire is restricted to φ = 107a; therefore, for a = 10-6 cm (10-7 cm), the potential reached is φ = 10 V (φ = 1 V). As a result, the electrostatic disruption criterion for the grains revert to that for the case
  V) (
V) ( V)); hence, when
  eV) (
eV) ( eV)). Therefore, the grain population affected by field emission may still be able to participate in electrostatic disruption. For example, when mb = 10-4 and taking V) (Te = 10 eV) as the grain potential reached,
  cm and so dust grains with a = 10-6 cm (i.e. those affected by field emission when Te = 100 eV) will still fracture. Furthermore, in substellar atmospheres dust grains are primarily composed of insulating material and so the work function can be larger e.g. Wf = 10 eV (Miloch et al. 2009), yielding larger tolerable values of Efe before field emission becomes a significant process.
4.2. Timescale considerations
The electrostatic disruption of dust in substellar plasmas will only have a significant effect on the particle size distribution if the timescale for disruption dominates over other dust growth and destruction timescales. In a fully ionized plasma where there are no neutrals, nucleation and growth as described by contemporary substellar atmosphere and cloud formation models is not suitable since the chemistry is predicated upon neutral gas-phase chemistry. In this case an extended approach of dust nucleation and growth in substellar plasmas is required. For a fully ionized plasma region, the timescale for electrostatic disruption precludes the timescale for other processes associated with charged dust and so electrostatic disruption will occur. In a partially ionized plasma, the ionized regions will be composed of gas-plasma mixtures and so if the gas is not sufficiently ionized then the nucleation and growth rate for dust formation could be greater than the rate of destruction via disruption.
The characteristic charging time for dust in a plasma is given by (Bouchoule 1999),
![\begin{eqnarray} && \tau_{\rm c}^{\rm B} = A^{-1}, \label{t_bohm} \\ && \tau_{\rm c}^{\rm OML} = \frac{1}{A}\left[\frac{T_{\rm e}}{T_{\rm i}}+\left(\frac{T_{\rm e}}{T_{\rm i}}\right)^{1/2}(1-y_{0})\right]^{-1}, \label{t_oml} \\ && A = \frac{an_{\rm e}e^{2}}{4\epsilon_{0}(m_{\rm i}k_{\rm B}T_{\rm e})^{1/2}}, \end{eqnarray}](/articles/aa/full_html/2015/07/aa26045-15/aa26045-15-eq216.png) where
where  is the Bohm theory characteristic charging time for dust;
  is the OML theory charging time; and y0 = − eφf/ (kBTe). Once seed dust particles are formed in substellar atmospheres they grow as they gravitationally settle until they ultimately evaporate at the base of the atmosphere. The grain-size dependent, equilibrium settling speed is obtained from the balance between the gravitational force and the frictional force exerted by the surrounding atmospheric gas on the dust grain (Woitke & Helling 2003). The net growth velocity for heterogeneous growth is χnet [cm s-1] (positive for growth; negative for evaporation) which includes all the growth velocities for each participating condensate,
  (Helling et al. 2008b). In Drift-Phoenix the growth process occurs through the physical adsorption of impinging gaseous molecules on the total grain surface. The molecules diffuse across the grain surface via hopping to a solid island of suitable composition where surface chemistry and chemisorption occurs, creating a new unit of material in the solid’s crystal structure (Helling & Woitke 2006). Note that the growth process is independent of the grain charge. Consider a seed particle in an atmospheric region that has just become partially ionized. If the seed particle can grow fast enough it may be able to surmount the critical radius and escape electrostatic disruption. As a result the particle size distribution function will not be truncated significantly by the process of electrostatic disruption. For a net growth velocity χnet, the time required for a particle to grow to a size is given by
  (15)Therefore, for electrostatic disruption to have a significant effect on the particle size distribution function we require the charging time to be less than the growth time (
 ),
),  (16)Figure 5 shows Eq. (16) evaluated as a function of atmospheric gas pressure using Eqs. (12) and (13) for the dust charging time and χnet from Drift-Phoenix. Figure 5 presents the worst case scenario for dust charging, where the atmospheric gas is just sufficiently ionized (i.e. fe = 10-7) to exhibit collective plasma effects, hence τc is at its largest; and the dust grains are very mechanically strong (i.e. mb = 1) resulting in having the smallest possible values and the quickest dust growth timescales,
  . In general, for all cases and all atmospheric gas pressures
  , so the seed dust grains charge quicker than the timescale for growth and the particle size distribution function will be significantly truncated by the electrostatic disruption of dust particles. As the atmospheric gas pressure increases, the gas-phase neutral number density increases and so for a given degree of ionization, the electron number density increases resulting in a smaller charging time and
  . For higher degrees of ionization, fe ≥ 10-7, the charging time decreases, becoming much faster than the net growth speed of the dust grains and the effect of electrostatic disruption is significant in the evolution of the particle size distribution function.
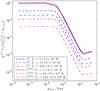 |
Fig. 5 Comparison of the competing timescales of dust growth and dust charging, evaluated for fe = 10-7, mb = 1 and a range of electron temperatures. |
4.3. Effect on the dust particle size distribution function
Cloud particles of size , immersed in a plasma, are subject to fracturing by electrostatic disruption. This can lead to a bimodal distribution of final grain sizes, comprising particles larger than and smaller than nano-sized seed particles (both of which are stable to disruption), with intermediate sizes expunged. This could yield regions of contrasting cloud properties in the atmosphere, thereby giving a source of inhomogeneous cloud coverage. To understand the role of electrostatic disruption in substellar atmospheres the effect on the dust particle size distribution function needs to be quantified.
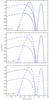 |
Fig. 6 Normalized potential exponential particle size distribution function |

 |
Fig. 7 Normalized lognormal particle size distribution function |
Figures 6 and 7 show how the particle size distribution function f(a,z) as a function of cloud particle size a, varies through the atmosphere, where z is the atmospheric height. Seed dust particles form high in the atmosphere, the dust settles under the effect of gravity as it grows and then finally evaporates at the base of the atmosphere. As a consequence, as the grains grow, the peak of the particle size distribution function migrates towards large particle sizes as the atmospheric gas pressure increases. Figures 6 and 7 show two potential particle size distribution functions derived using the dust moments, 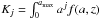 da, from Drift-Phoenix: a potential exponential size distribution (Helling et al. 2008b) and a lognormal size distribution. The lognormal distribution is included to increase the impact and relevance of the results presented here to other models where such a distribution function is assumed. Using the Drift-Phoenix dust moments a lognormal particle size distribution function can be given by
 ![\begin{equation} f(a,z)=\frac{1}{a\sigma\sqrt{2\pi}}\exp{\left[-\frac{(\ln{(a)}-\mu)^{2}}{2\sigma^{2}}\right]}, \end{equation}](/articles/aa/full_html/2015/07/aa26045-15/aa26045-15-eq234.png) (17)where μ and σ are the mean and variance of the distribution respectively and are given by,
(17)where μ and σ are the mean and variance of the distribution respectively and are given by, ![\begin{eqnarray} \mu&=&\ln{\left[\frac{ \langle a\rangle^{2}}{\sqrt{\langle A\rangle+\langle a\rangle^{2}}}\right]}, \\ \sigma&=&\frac{1}{2}\ln{\left(\frac{\langle A\rangle}{\langle a\rangle^{2}}+1\right)}, \end{eqnarray}](/articles/aa/full_html/2015/07/aa26045-15/aa26045-15-eq236.png) where
where  and ⟨ A ⟩ is the mean dust surface area [cm2]. In Figs. 6 and 7 each curve represents the dust particle size distribution function at different atmospheric heights, starting at the cloud top where pgas ≈ 10-11 bar and finishing at the bottom of the cloud where pgas ≈ 10-3 bar. The top, middle and bottom subplots show results for when mb = 1, 10-2 and 10-4 respectively, for the case Te = 10 eV (Bohm theory). As mb decreases and increases, larger regions of the particle size distribution f(a,z) become Coulomb unstable and deeper cloud layers, where grains are larger in size, become increasingly affected. The distribution function resulting from the Coulomb explosion of charged dust cloud particles in a plasma can be given by
 ![\begin{equation} g(a,z)=\left\{\begin{array}{ll}\displaystyle n^{\rm seed}_{\rm d}\delta(a-a_{\rm seed}) & a\in \left[a_{\rm seed},a^{\rm Coul}_{\rm crit}\right) \\[2mm] f(a,z) & a\in\left[a_{\rm crit}^{\rm Coul},a_{\rm max}\right]\end{array} \right. \end{equation}](/articles/aa/full_html/2015/07/aa26045-15/aa26045-15-eq241.png) (22)where,
(22)where,  Note that if the Coulomb explosion process manages to destroy all the large dust particles, all that will remain is a dust cloud composed of nanometre seed particles.
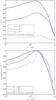 |
Fig. 8 Dust optical depth |
4.4. Observational consequences of electrostatic disruption
The resulting optical depth,  , due to the particle size distribution of the dust can be calculated by evaluating the following double integral,
  (26)where Qext = Qext(a,λ,Vs) is the extinction efficiency of the dust, which is a function of the dust particle size, wavelength and volume fraction Vs. The optical depth is of interest since it determines the intensity (and therefore the flux density for a given solid angle) that is observed. The contrast in optical depth between different atmospheric regions will be seen as a change in the observed flux density. Figure 8 shows the resulting dust optical depth as a function of wavelength (0.1 − 10 μm) for a region of the atmosphere where the Coulomb explosion of dust particles occurs. To exemplify the Coulomb explosion model an atmospheric plasma region stretching from the bottom of the cloud to the top is considered, using for Te = 10 eV (Bohm) to calculate g(a,z) and for a lognormal distribution function. To calculate the extinction efficiency, a bespoke Mie scattering numerical routine was utilized using the Bruggeman approximation (Bruggeman 1935) to calculate the effective optical constants of the dust grains using values from the references listed in Table 2. The optical depth is calculated using a Simpson’s numerical integration routine over the entire dust particle size distribution function g(a,z) and over the entire cloud extent in z.
As mb decreases in size and the effect of Coulomb explosions increases, more and more dust grains are broken up, leaving a thinner cloud structure with a lower optical depth with respect to adjacent cloud regions where the process is absent. As a result, the contrasting electromagnetic properties of the neighbouring regions would manifest itself observationally as patchy cloud coverage. For comparison, the optical depth for an atmospheric region unaffected by electrostatic disruption is shown (black solid line).
For clouds with a distribution of particle sizes, dust grains with a length scale comparable to (or harmonics of) the wavelength of the interacting electromagnetic waves resonate most effectively with the radiation. The general profile of the dust optical depth as a function of wavelength λ is determined by the superposition of resonant interactions between the electromagnetic radiation and the dust particles. We are interested in photometric variability in the infrared wavelength range corresponding to dust particles with diameters in the micrometer range. As a result, the optical depth peaks at a wavelength, where the dust cloud is optically thicker, given by λpeak ≈ 2 ⟨ a ⟩ ∗ where,  (27)Note that in the wavelength range of interest (λ = 0.1 − 10 μm) the effect of the population of seed particles (
 nm)) is negligible relative to the effect of the micrometer-sized population, since Mie scattering (λ-1 for a ≈ λ) dominates over Rayleigh scattering (λ-4 for a ≪ λ). As mb decreases, the critical radius increases, the extent of the truncation of the particle size distribution increases and the resulting mean particle size, ⟨ a ⟩ ∗, increases, shifting the peak in the optical depth to higher wavelengths. Further to this, since the dust particle population is depleted, the cloud becomes optically thinner. In the case mb = 10-4 the truncation of the particle size distribution is more severe with
  cm to amax, completely reducing the upper cloud layers to only an ensemble of nanometre sized dust particles. In addition to the population of seed particles at aseed, the particle size distribution in lower cloud layers is restricted to a narrow distribution of larger dust grains. As a result of this narrow distribution, there is insufficient overlap in the resonant features at wavelengths corresponding to harmonics of the dust diameter, to guarantee a continuous optical depth profile; hence, the dip in the optical depth at λ ≈ 1.2 μm. This is in contrast to the cases mb = 10-3 − 1, where the spread in particle sizes is sufficiently broad that the dust-radiation resonant features form a continuous optical depth profile. In the extreme case where all dust particles fall below the critical threshold for stability, only a cloud composed of nanometre-sized seed dust particles will exist making the cloud optically thin in the wavelength range presented here (0.1 − 10 μm) with a characteristic Rayleigh scattering intensity dependence. These features present useful diagnostics for distinguishing the Coulomb explosion process from other inhomogeneous cloud coverage mechanisms.
Reference list for the optical constants of the materials used to calculate the extinction efficiency, Qext.
5. Discussion
The aim of this paper was to investigate the electrostatic disruption of cloud dust particles in substellar atmospheres and to assess the contribution to inhomogeneous cloud coverage and the resulting spectroscopic variability. Dust cloud particles immersed in a plasma region, with a radius below a critical radius are electrostatically disrupted and broken apart. This results in a bimodal particle size distribution composed of stable nanoscale seed particles and particles with  , with the intervening range of particle sizes defining a region of instability devoid of dust. For an atmospheric plasma region with an electron temperature of Te = 10 eV, the critical grain radius varies from
  cm to 10-4 cm depending on the tensile strength of the dust particle, characterized by mb = 1 to 10-4 respectively. Higher critical radii are attainable for higher electron temperatures. As mb decreases, the dust population is depleted and the clouds become optically thin. Furthermore, as the critical radius increases, the extent of the truncation of the particle size distribution increases and the resulting mean particle size increases, shifting the wavelength-particle size resonant peak in the optical depth to higher IR wavelengths. Depending on the distribution of the dusty plasma regions in the substellar atmosphere, electrostatic disruption of dust clouds could yield regions of contrasting cloud and optical properties, which gives a source of inhomogeneous cloud coverage that could be associated with the observed spectroscopic variability. If the entirety of the atmosphere is ionized then all the atmospheric dust is charged and susceptible to electrostatic disruption. In this case inhomogeneous cloud coverage would occur due to non-uniformity in the electron temperature across the atmosphere since is dependent upon the electron temperature.
The electrostatic disruption of dust grains in substellar atmospheres has a significant impact on the subsequent chemistry that occurs. Consider a spherical dust grain of radius a and corresponding surface area. If such a grain is electrostatically disrupted it will break-up into numerous smaller fragments each with a smaller surface area than the initial, parent dust grain. However, the resultant combined surface area of the fragment ensemble will be greater than that of the initial dust grain. As a result, reagents and radicals have a greater surface area available to them, promoting surface catalysis. The increased collective surface area from fragmentation is in analogy with micronized coal-fired power generation: lumps of coal are broken-up into micrometer sized particulates (via a collisional process) the collective surface area of the micronized coal is greater than that of the parent lump. Therefore, surface catalysis is enhanced and the efficiency of combustion increased resulting in a greater energy yield in comparison to standard coal-fired stations. Although the specific chemical reactions in the micronized coal context are different, the underlying physical principle is the same: an increased surface area enhances the chemical reactivity. The increased reaction surface area may cause a stronger depletion of the gas-phase species that participate in grain surface chemistry (see Table 1, Helling et al. 2008b). Hence, localized time-dependent gas-phase depletion may well be caused by a sudden population boost of small grains induced by electrostatic disruption of larger grains.
The electrostatic disruption of dust grains may also be applicable in other astrophysical, dusty plasma environments, such as supernova remnants. Supernova remnants are associated with the creation of a series of shocks that propagate through the dusty ejecta affecting dust formation and destruction. Investigations have suggested that grains with a length scale ≲ 0.05 μm are destroyed by sputtering in the post-shock flow while those ≈ 0.05 − 0.2 μm are trapped in the shock (Nozawa et al. 2007). The fraction of dust that survives the passage of the shock ranges between 2−20% (Bianchi & Schneider 2007), which may be further affected by additional processes such as the electrostatic disruption of dust. Furthermore, observed silicate features in protoplanetary disks are believed to be consistent with the existence of a population of micrometer sized grains and the absence of sub-micrometer sized grains (Williams & Cieza 2011). To produce such a particle size distribution, Olofsson et al. (2009) suggest that either dust growth processes dominate fragmentation at these length scales or the sub-micrometer dust grains are removed from the upper layers of the disk via winds or radiation pressure. The electrostatic disruption of dust particles could be an additional mechanism aiding in the removal of the sub-micrometer particles from the upper layers of the disk.
Acknowledgments
The authors are grateful to the anonymous referee for constructive comments and suggestions that have improved this paper. Ch.H. and C.R.S. are grateful for the financial support of the European Community under the FP7 by an ERC starting grant number 257431. D.A.D. is grateful for funding from the UK Science and Technology Funding Council via grant number ST/I001808/1. It is a pleasure to acknowledge stimulating discussions with Drs H. E. Potts and P. B. Rimmer. Further to this, the authors would like to thank D. Juncher for discussions regarding dust opacity. The authors would like to acknowledge our local IT support.
References
- Ackerman, A. S., & Marley, M. S. 2001, ApJ, 556, 872 [NASA ADS] [CrossRef] [Google Scholar]
- Alfvén, H. 1960, Rev. Mod. Phys., 32, 710 [NASA ADS] [CrossRef] [Google Scholar]
- Allard, F., Hauschildt, P. H., Alexander, D. R., Tamanai, A., & Schweitzer, A. 2001, ApJ, 556, 357 [NASA ADS] [CrossRef] [Google Scholar]
- Allard, F., Homeier, D., Freytag, B., et al. 2013, Mem. Soc. Astron. It. Suppl., 24, 128 [Google Scholar]
- Allen, J. E., Boyd, R. L. F., & Reynolds, P. 1957, Proc. Phys. Soc. B, 70, 297 [NASA ADS] [CrossRef] [Google Scholar]
- Antonova, A., Hallinan, G., Doyle, J. G., et al. 2013, A&A, 549, A131 [NASA ADS] [CrossRef] [EDP Sciences] [Google Scholar]
- Apai, D., Radigan, J., Buenzli, E., et al. 2013, ApJ, 768, 121 [NASA ADS] [CrossRef] [Google Scholar]
- Artigau, É., Bouchard, S., Doyon, R., & Lafrenière, D. 2009, ApJ, 701, 1534 [NASA ADS] [CrossRef] [Google Scholar]
- Axford, W. I., & Mendis, D. A. 1974, Ann. Rev. Earth Planet. Sci., 2, 419 [NASA ADS] [CrossRef] [Google Scholar]
- Bailer-Jones, C. A. L., & Mundt, R. 2001, A&A, 367, 218 [NASA ADS] [CrossRef] [EDP Sciences] [Google Scholar]
- Bailey, R. L., Helling, C., Hodosán, G., Bilger, C., & Stark, C. R. 2014, ApJ, 784, 43 [NASA ADS] [CrossRef] [Google Scholar]
- Becker, K. H., Schoenbach, K. H., & Eden, J. G. 2006, J. Phys. D, 39, 55 [Google Scholar]
- Berger, E., Rutledge, R. E., Phan-Bao, N., et al. 2009, ApJ, 695, 310 [NASA ADS] [CrossRef] [Google Scholar]
- Bianchi, S., & Schneider, R. 2007, MNRAS, 378, 973 [NASA ADS] [CrossRef] [Google Scholar]
- Biller, B. A., Crossfield, I. J. M., Mancini, L., et al. 2013, ApJ, 778, L10 [NASA ADS] [CrossRef] [Google Scholar]
- Bouchoule, A. 1999, Dusty Plasmas: Physics, Chemistry and Technological Impact in Plasma Processing (John Wiley and Sons Ltd) [Google Scholar]
- Bruggeman, D. A. G. 1935, Annalen der Physik, 416, 636 [NASA ADS] [CrossRef] [Google Scholar]
- Buenzli, E., Apai, D., Morley, C. V., et al. 2012, ApJ, 760, L31 [NASA ADS] [CrossRef] [Google Scholar]
- Buenzli, E., Apai, D., Radigan, J., Reid, I. N., & Flateau, D. 2014, ApJ, 782, 77 [NASA ADS] [CrossRef] [Google Scholar]
- Burgasser, A. J., Marley, M. S., Ackerman, A. S., et al. 2002, ApJ, 571, L151 [NASA ADS] [CrossRef] [Google Scholar]
- Burgasser, A. J., Gillon, M., Faherty, J. K., et al. 2014, ApJ, 785, 48 [NASA ADS] [CrossRef] [Google Scholar]
- Burrows, A., Marley, M., Hubbard, W. B., et al. 1997, ApJ, 491, 856 [NASA ADS] [CrossRef] [Google Scholar]
- Burrows, A., Sudarsky, D., & Hubeny, I. 2006, ApJ, 640, 1063 [NASA ADS] [CrossRef] [Google Scholar]
- Callister, W. D. 1985, Materials Science and Engineering An Introduction (John Wiley & Sons) [Google Scholar]
- Chen, F. F. 1984, Introduction to plasma physics and controlled fusion, Vol. 1, plasma physics (Plenum Press) [Google Scholar]
- Crossfield, I. J. M., Biller, B., Schlieder, J. E., et al. 2014, Nature, 505, 654 [NASA ADS] [CrossRef] [Google Scholar]
- Dehn, M. 2007, Ph.D. Thesis, University of Hamburg [Google Scholar]
- Diver, D. A. 2013, A plasma formulary for physics, technology, and astrophysics (Wiley – VCH) [Google Scholar]
- Diver, D. A., Fletcher, L., & Potts, H. E. 2005, Sol. Phys., 227, 207 [NASA ADS] [CrossRef] [Google Scholar]
- Draine, B. T., & Salpeter, E. E. 1979, ApJ, 231, 77 [NASA ADS] [CrossRef] [Google Scholar]
- Dupuy, T. J., & Liu, M. C. 2012, ApJS, 201, 19 [NASA ADS] [CrossRef] [Google Scholar]
- Faherty, J. K., Burgasser, A. J., Walter, F. M., et al. 2012, ApJ, 752, 56 [NASA ADS] [CrossRef] [Google Scholar]
- Fomenkova, M. N., & Mendis, D. A. 1992, Ap&SS, 189, 327 [NASA ADS] [CrossRef] [Google Scholar]
- Freytag, B., Allard, F., Ludwig, H.-G., Homeier, D., & Steffen, M. 2010, A&A, 513, A19 [NASA ADS] [CrossRef] [EDP Sciences] [Google Scholar]
- Fridman, A. 2008, Plasma Chemistry (Cambridge University Press) [Google Scholar]
- Gelino, C. R., Marley, M. S., Holtzman, J. A., Ackerman, A. S., & Lodders, K. 2002, ApJ, 577, 433 [NASA ADS] [CrossRef] [Google Scholar]
- Gillon, M., Triaud, A. H. M. J., Jehin, E., et al. 2013, A&A, 555, L5 [NASA ADS] [CrossRef] [EDP Sciences] [Google Scholar]
- Girardin, F., Artigau, É., & Doyon, R. 2013, ApJ, 767, 61 [NASA ADS] [CrossRef] [Google Scholar]
- Gomer, R. 1961, Field emission and field ionization, Harvard monographs in applied science (Harvard University Press) [Google Scholar]
- Gronkowski, P. 2009, Astron. Nachr., 330, 784 [NASA ADS] [CrossRef] [Google Scholar]
- Hallinan, G., Antonova, A., Doyle, J. G., et al. 2008, ApJ, 684, 644 [NASA ADS] [CrossRef] [Google Scholar]
- Hauschildt, P. H., & Baron, E. 1999, J. Comput. Appl. Math., 109, 41 [NASA ADS] [CrossRef] [Google Scholar]
- Helling, C., & Casewell, S. 2014, A&ARv, 22, 80 [NASA ADS] [CrossRef] [Google Scholar]
- Helling, C., & Rietmeijer, F. J. M. 2009, Int. J. Astrobiol., 8, 3 [NASA ADS] [CrossRef] [Google Scholar]
- Helling, C., & Woitke, P. 2006, A&A, 455, 325 [NASA ADS] [CrossRef] [EDP Sciences] [Google Scholar]
- Helling, C., Klein, R., Woitke, P., Nowak, U., & Sedlmayr, E. 2004, A&A, 423, 657 [NASA ADS] [CrossRef] [EDP Sciences] [Google Scholar]
- Helling, C., Ackerman, A., Allard, F., et al. 2008a, MNRAS, 391, 1854 [NASA ADS] [CrossRef] [Google Scholar]
- Helling, C., Woitke, P., & Thi, W.-F. 2008b, A&A, 485, 547 [NASA ADS] [CrossRef] [EDP Sciences] [Google Scholar]
- Helling, C., Jardine, M., & Mokler, F. 2011a, ApJ, 737, 38 [NASA ADS] [CrossRef] [Google Scholar]
- Helling, C., Jardine, M., Witte, S., & Diver, D. A. 2011b, ApJ, 727, 4 [NASA ADS] [CrossRef] [Google Scholar]
- Helling, C., Jardine, M., Stark, C., & Diver, D. 2013, ApJ, 767, 136 [NASA ADS] [CrossRef] [Google Scholar]
- Hill, J. R., & Mendis, D. A. 1981, Can. J. Phys., 59, 897 [NASA ADS] [CrossRef] [Google Scholar]
- Hsieh, C., & Tuan, W. 2005, Mat. Sci. Eng. A, 393, 133 [CrossRef] [Google Scholar]
- Ishihara, O. 2007, J. Phys. D, 40, 121 [Google Scholar]
- Jäger, C., Dorschner, J., Mutschke, H., Posch, T., & Henning, T. 2003, A&A, 408, 193 [NASA ADS] [CrossRef] [EDP Sciences] [Google Scholar]
- Khol, W. H. 1995, Handbook of Materials and Techniques for Vacuum Devices (AIP Press) [Google Scholar]
- Kim, H. S., Hong, S. I., & Kim, S. J. 2001, J. Mat. Process. Technol., 112, 109 [CrossRef] [Google Scholar]
- Knapp, G. R., Leggett, S. K., Fan, X., et al. 2004, AJ, 127, 3553 [NASA ADS] [CrossRef] [Google Scholar]
- Li, G., Helms, J. E., Pang, S.-S., & Schulz, K. 2001, Polymer Composites, 22, 593 [CrossRef] [Google Scholar]
- Li, Z., Schmauder, S., & Dong, M. 1999, Comput. Mat. Sci., 15, 11 [CrossRef] [Google Scholar]
- Lieberman, M., & Lichtenberg, A. 2005, in Principles of Plasma Discharges and Materials Processing, 2nd edn. (Wiley), 1 [Google Scholar]
- Littlefair, S. P., Dhillon, V. S., Marsh, T. R., et al. 2008, MNRAS, 391, L88 [NASA ADS] [Google Scholar]
- Lynch, C. 1983, Handbook of Materials Science: General Properties (Taylor & Francis) [Google Scholar]
- MacLachlan, C. S., Diver, D. A., & Potts, H. E. 2009, New J. Phys., 11, 063001 [NASA ADS] [CrossRef] [Google Scholar]
- MacLachlan, C. S., Potts, H. E., & Diver, D. A. 2013, Plasma Sources Sci. Technol., 22 [Google Scholar]
- Mann, I., Meyer-Vernet, N., & Czechowski, A. 2014, Phys. Rep., 536, 1 [NASA ADS] [CrossRef] [Google Scholar]
- Marley, M. S., Seager, S., Saumon, D., et al. 2002, ApJ, 568, 335 [NASA ADS] [CrossRef] [Google Scholar]
- McLean, M., Berger, E., & Reiners, A. 2012, ApJ, 746, 23 [NASA ADS] [CrossRef] [Google Scholar]
- Metchev, S., Apai, D., Radigan, J., et al. 2013, Astron. Nachr., 334, 40 [NASA ADS] [CrossRef] [Google Scholar]
- Miloch, W. J., Vladimirov, S. V., Pécseli, H. L., & Trulsen, J. 2009, New J. Phys., 11, 043005 [NASA ADS] [CrossRef] [Google Scholar]
- Morley, C. V., Fortney, J. J., Marley, M. S., et al. 2012, ApJ, 756, 172 [NASA ADS] [CrossRef] [Google Scholar]
- Morley, C. V., Marley, M. S., Fortney, J. J., & Lupu, R. 2014, ApJ, 789, L14 [NASA ADS] [CrossRef] [Google Scholar]
- Nozawa, T., Kozasa, T., Habe, A., et al. 2007, ApJ, 666, 955 [NASA ADS] [CrossRef] [Google Scholar]
- Olofsson, J., Augereau, J.-C., van Dishoeck, E. F., et al. 2009, A&A, 507, 327 [NASA ADS] [CrossRef] [EDP Sciences] [Google Scholar]
- Opik, E. J. 1956, Ir. Astron. J., 4, 84 [NASA ADS] [Google Scholar]
- Ordal, M. A., Bell, R. J., Alexander, Jr., R. W., Newquist, L. A., & Querry, M. R. 1988, Appl. Opt., 27, 1203 [NASA ADS] [CrossRef] [PubMed] [Google Scholar]
- Osten, R. A., Phan-Bao, N., Hawley, S. L., Reid, I. N., & Ojha, R. 2009, ApJ, 700, 1750 [NASA ADS] [CrossRef] [Google Scholar]
- Palik, E. D. 1985, Handbook of optical constants of solids (New York: Academic Press) [Google Scholar]
- Palik, E. D. 1991, Handbook of optical constants of solids II (Boston: Academic Press) [Google Scholar]
- Petrovic, J. 2001, J. Mat. Sci., 36, 1579 [NASA ADS] [CrossRef] [Google Scholar]
- Popova, O., Borovička, J., Hartmann, W. K., et al. 2011, Meteor. Planet. Sci., 46, 1525 [Google Scholar]
- Posch, T., Kerschbaum, F., Fabian, D., et al. 2003, ApJS, 149, 437 [NASA ADS] [CrossRef] [Google Scholar]
- Qiu, S., & Kalita, S. J. 2006, Mat. Sci. Eng. A, 435–436, 327 [CrossRef] [Google Scholar]
- Raabe, D., & Hangen, U. 1995, Composites Sci. Technol., 55, 57 [CrossRef] [Google Scholar]
- Radigan, J., Jayawardhana, R., Lafrenière, D., et al. 2012, ApJ, 750, 105 [NASA ADS] [CrossRef] [Google Scholar]
- Rhee, J. W. 1976, in Interplanetary Dust and Zodiacal Light, eds. H. Elsaesser, & H. Fechtig (Berlin: Springer Verlag), Lect. Notes Phys., 48, 238 [Google Scholar]
- Rimmer, P. B., & Helling, C. 2013, ApJ, 774, 108 [NASA ADS] [CrossRef] [Google Scholar]
- Rosenberg, M., & Mendis, D. A. 1992, J. Geophys. Res., 97, 14773 [NASA ADS] [CrossRef] [Google Scholar]
- Route, M., & Wolszczan, A. 2012, ApJ, 747, L22 [NASA ADS] [CrossRef] [Google Scholar]
- Scholz, A., & Eislöffel, J. 2005, A&A, 429, 1007 [NASA ADS] [CrossRef] [EDP Sciences] [Google Scholar]
- Schulz, R., Hilchenbach, M., Langevin, Y., et al. 2015, Nature, 518, 216 [NASA ADS] [CrossRef] [Google Scholar]
- Shackelford, J., & Alexander, W. 2000, CRC Materials Science and Engineering Handbook, 3rd edn. (Taylor & Francis) [Google Scholar]
- Showman, A. P., & Kaspi, Y. 2013, ApJ, 776, 85 [NASA ADS] [CrossRef] [Google Scholar]
- Shukla, P. K. 2001, Phys. Plasmas, 8, 1791 [NASA ADS] [CrossRef] [Google Scholar]
- Stark, C. R., Potts, H. E., & Diver, D. A. 2006, A&A, 457, 365 [NASA ADS] [CrossRef] [EDP Sciences] [Google Scholar]
- Stark, C. R., Helling, C., Diver, D. A., & Rimmer, P. B. 2013, ApJ, 776, 11 [NASA ADS] [CrossRef] [Google Scholar]
- Stokes, R. J., & Li, C. H. 1963, J. Am. Ceram. Soc., 46, 423 [CrossRef] [Google Scholar]
- Tinney, C. G., Burgasser, A. J., & Kirkpatrick, J. D. 2003, AJ, 126, 975 [NASA ADS] [CrossRef] [Google Scholar]
- Torquato, S. 2000, Int. J. Solids Structures, 37, 411 [CrossRef] [Google Scholar]
- Torquato, S., Yeong, C. L. Y., Rintoul, M. D., Milius, D. L., & Aksay, I. A. 1999, J. Am. Ceram. Soc., 82, 1263 [CrossRef] [Google Scholar]
- Tsuji, T. 2002, ApJ, 575, 264 [NASA ADS] [CrossRef] [Google Scholar]
- Tsuji, T. 2005, ApJ, 621, 1033 [NASA ADS] [CrossRef] [Google Scholar]
- Williams, J. P., & Cieza, L. A. 2011, ARA&A, 49, 67 [NASA ADS] [CrossRef] [Google Scholar]
- Witte, S., Helling, C., & Hauschildt, P. H. 2009, A&A, 506, 1367 [NASA ADS] [CrossRef] [EDP Sciences] [Google Scholar]
- Witte, S., Helling, C., Barman, T., Heidrich, N., & Hauschildt, P. H. 2011, A&A, 529, A44 [NASA ADS] [CrossRef] [EDP Sciences] [Google Scholar]
- Woitke, P., & Helling, C. 2003, A&A, 399, 297 [NASA ADS] [CrossRef] [EDP Sciences] [Google Scholar]
- Woitke, P., & Helling, C. 2004, A&A, 414, 335 [NASA ADS] [CrossRef] [EDP Sciences] [Google Scholar]
- Zeidler, S., Posch, T., Mutschke, H., Richter, H., & Wehrhan, O. 2011, A&A, 526, A68 [NASA ADS] [CrossRef] [EDP Sciences] [Google Scholar]
- Zeidler, S., Posch, T., & Mutschke, H. 2013, A&A, 553, A81 [NASA ADS] [CrossRef] [EDP Sciences] [Google Scholar]
All Tables
Reference list for the optical constants of the materials used to calculate the extinction efficiency, Qext.
All Figures
|
Fig. 1 Volume fraction Vs/Vtot and the mean grain size ⟨ a ⟩ of a mineral cloud in a substellar atmosphere with Teff = 1600 K and log g = 3. Results are from the Drift-Phoenix model atmosphere simulation and is consistent with Helling et al. (2008b). |
| In the text | |
|
Fig. 2 Ratio of the sheath extent to the ion-neutral mean free path δni = dsh/λmfp,n as a function of atmospheric gas pressure pgas for the same model atmosphere as in Fig. 1. δni is plotted for degrees of ionization fe = 10-7, 10-4 and 10-1 and electron temperatures Te = Tgas ( |
| In the text | |
|
Fig. 3 Ratio of the dust grain radius to the sheath extent ξ = a/dsh as a function of atmospheric gas pressure pgas for the same model atmosphere as in Fig. 1. ξ is plotted for a = ⟨ a ⟩, for degrees of ionization fe = 10-7 and 1 and electron temperatures Te = Tgas ( |
| In the text | |
|
Fig. 4
|
| In the text | |
|
Fig. 5 Comparison of the competing timescales of dust growth and dust charging, evaluated for fe = 10-7, mb = 1 and a range of electron temperatures. |
| In the text | |
|
Fig. 6 Normalized potential exponential particle size distribution function |
| In the text | |
|
Fig. 7 Normalized lognormal particle size distribution function |
| In the text | |
|
Fig. 8 Dust optical depth |
| In the text | |
Current usage metrics show cumulative count of Article Views (full-text article views including HTML views, PDF and ePub downloads, according to the available data) and Abstracts Views on Vision4Press platform.
Data correspond to usage on the plateform after 2015. The current usage metrics is available 48-96 hours after online publication and is updated daily on week days.
Initial download of the metrics may take a while.