Fig. 8
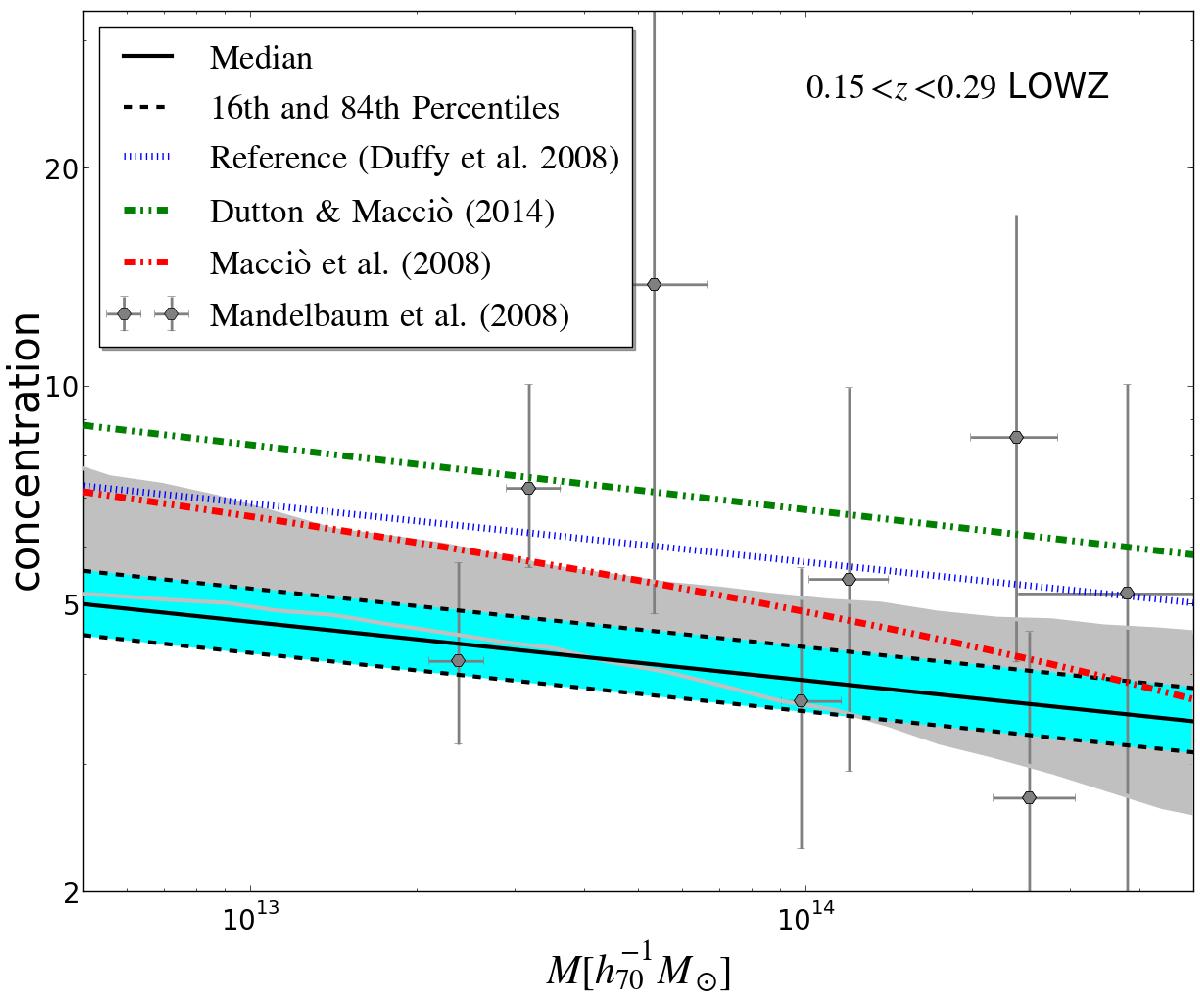
Best-fit mass-concentration relation derived for the 0.15<z<0.29 LOWZ bin. The solid black line indicates the best-fit result and the turquoise area the 68% confidence intervals. The blue dotted line shows the reference relation from Duffy et al. (2008), whose amplitude we fit in the halo model. The red and green dotted-dashed lines show the relations from Macciò et al. (2008) and Dutton & Macciò (2014), respectively. The black points and the grey area are the results from direct fits to lensing data from Mandelbaum et al. (2008).
Current usage metrics show cumulative count of Article Views (full-text article views including HTML views, PDF and ePub downloads, according to the available data) and Abstracts Views on Vision4Press platform.
Data correspond to usage on the plateform after 2015. The current usage metrics is available 48-96 hours after online publication and is updated daily on week days.
Initial download of the metrics may take a while.