Fig. 3
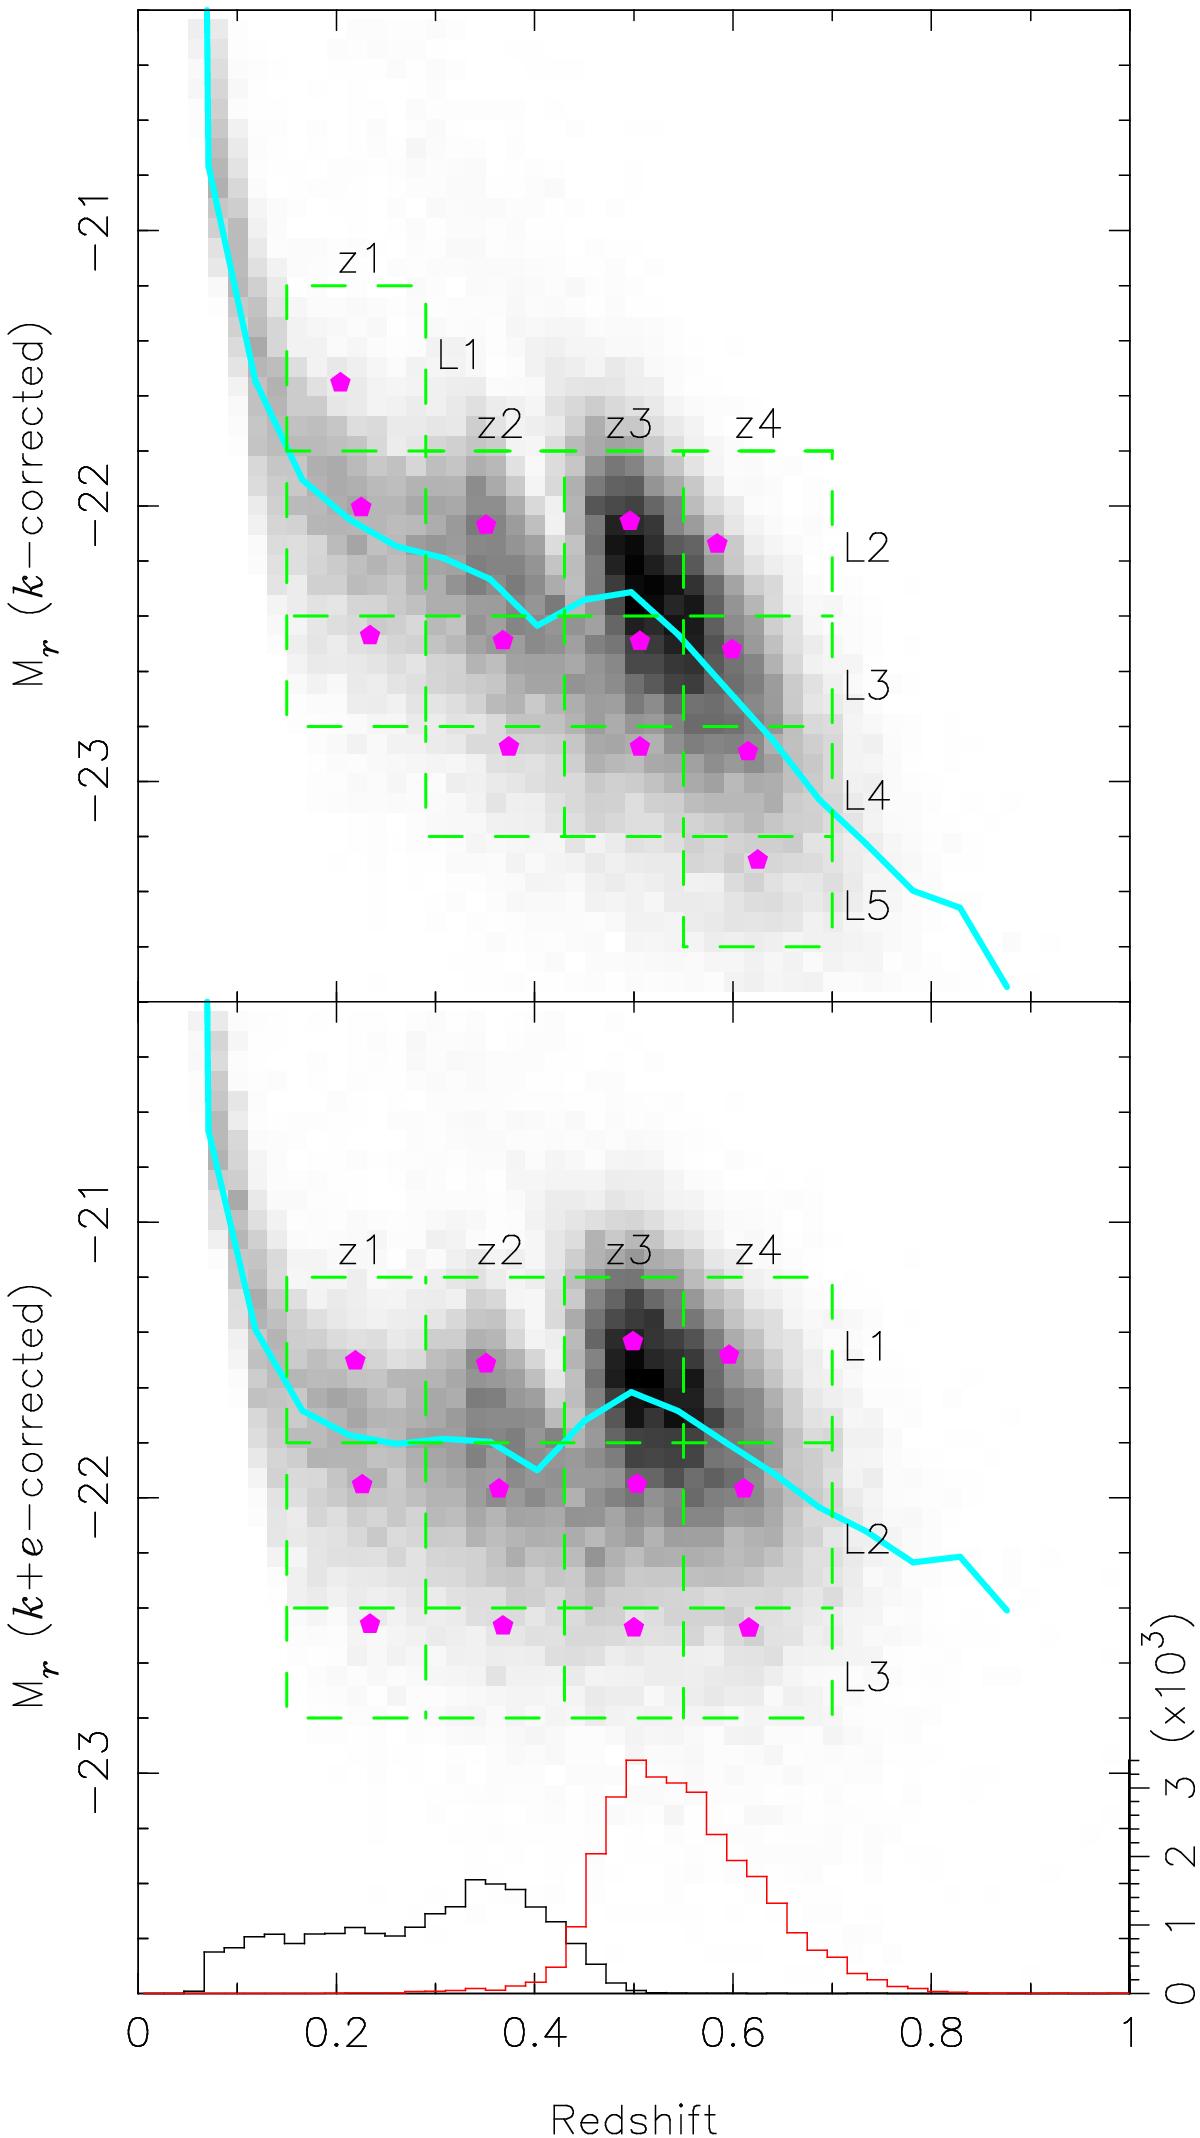
Distribution of absolute magnitudes and redshifts of our LRG lenses after the k-correction (top) and after the k-correction and luminosity evolution correction (bottom). The solid cyan line indicates the median. The green dashed boxes show the redshift and luminosity cuts on our lens sample; the magenta pentagons indicate the mean redshift and luminosity of those bins. The total density of LRGs as a function of redshift is shown by the black and red histograms on the horizontal axis for the LOWZ and CMASS galaxies, respectively.
Current usage metrics show cumulative count of Article Views (full-text article views including HTML views, PDF and ePub downloads, according to the available data) and Abstracts Views on Vision4Press platform.
Data correspond to usage on the plateform after 2015. The current usage metrics is available 48-96 hours after online publication and is updated daily on week days.
Initial download of the metrics may take a while.