Fig. 2
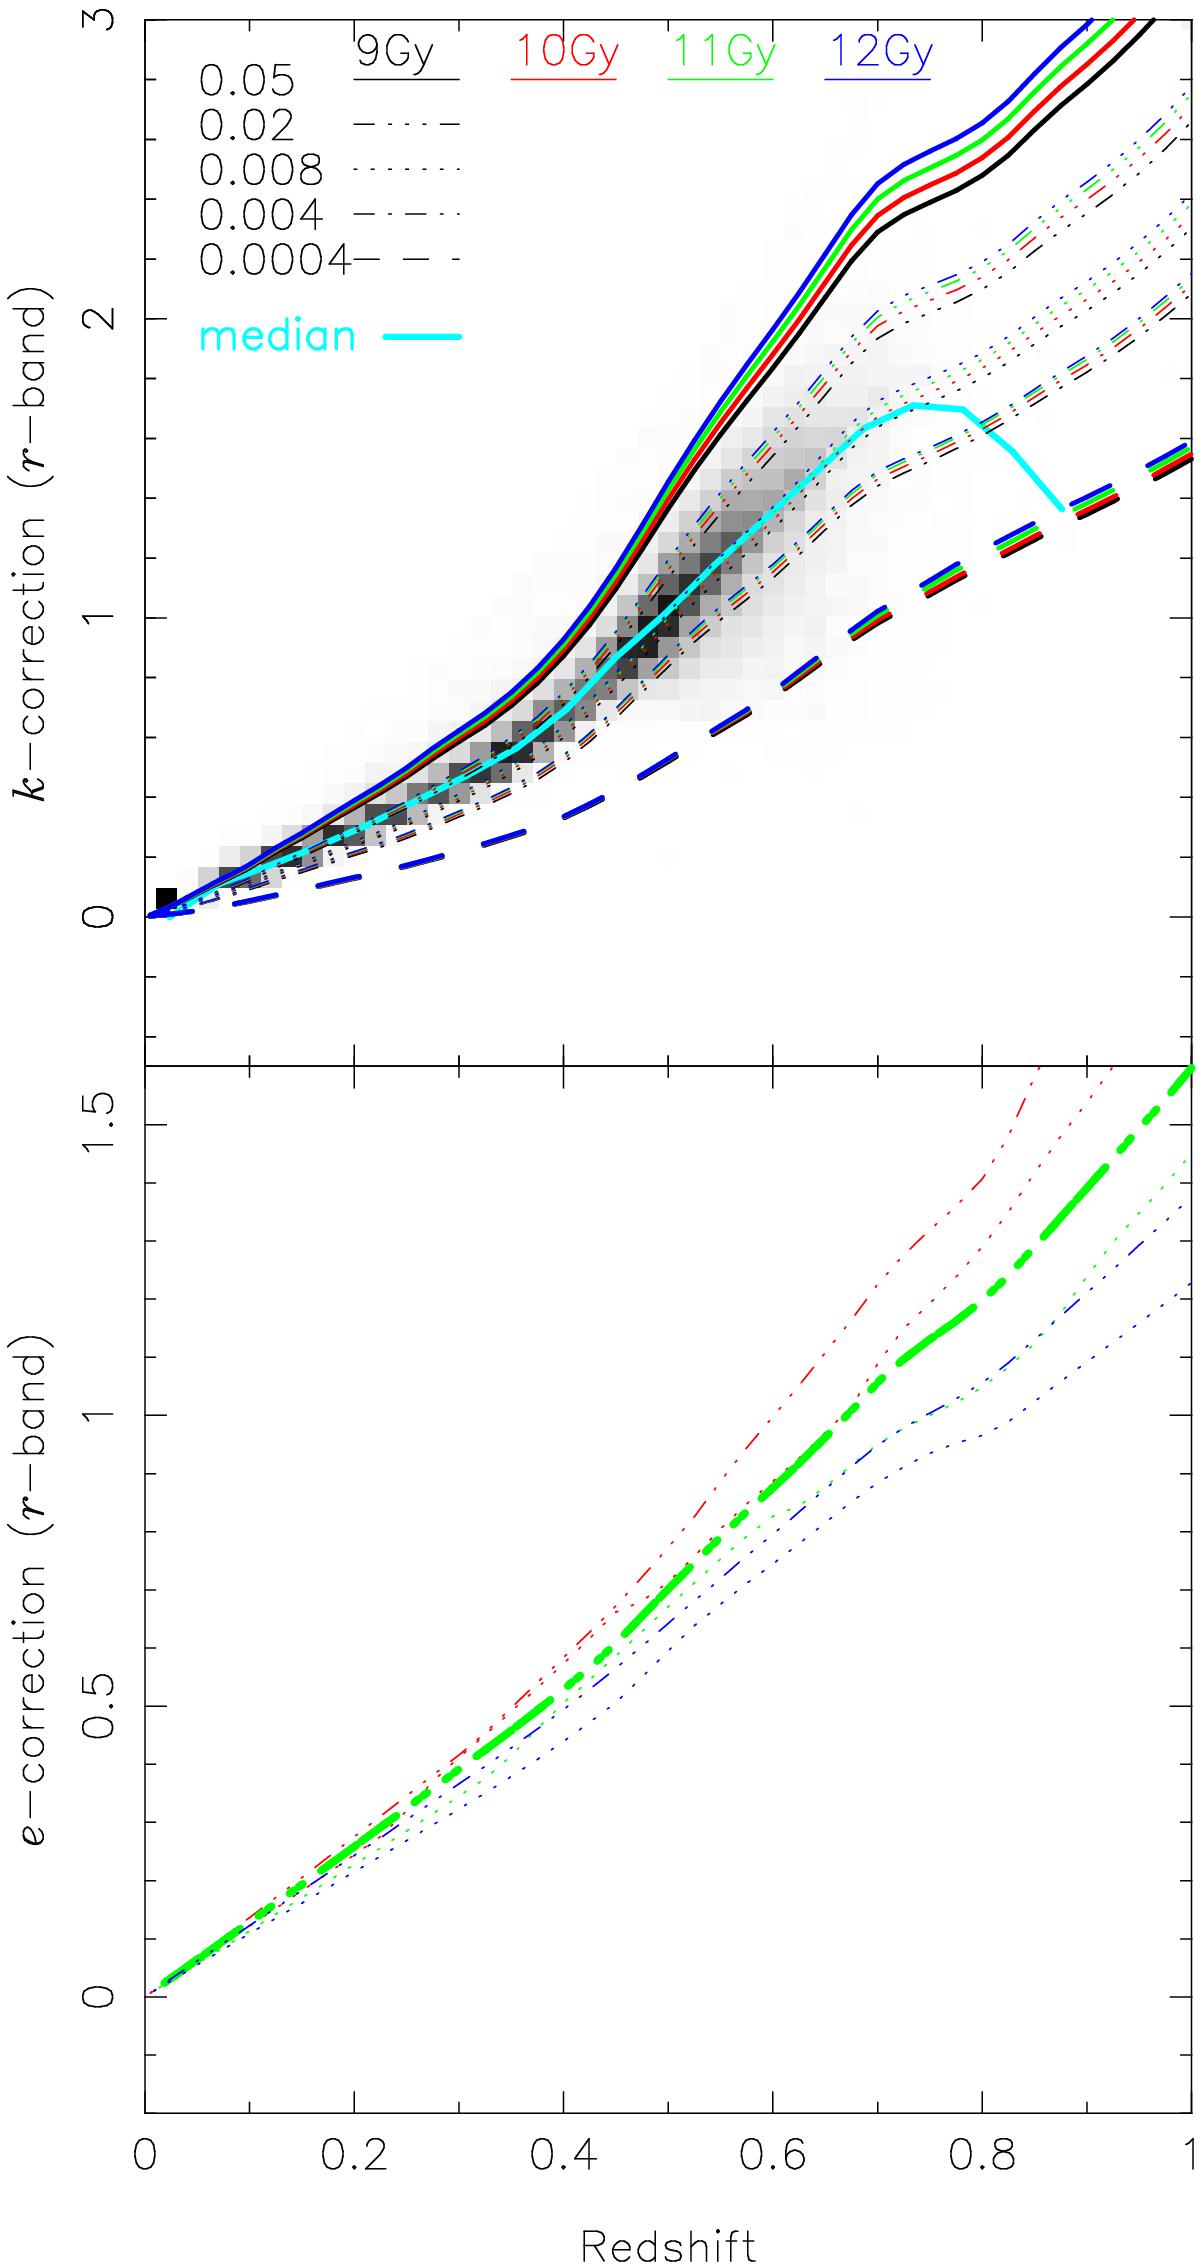
Top panel: k-correction as a function of redshift. The gray scale shows the k-corrections from the KCORRECT code, the solid cyan line indicates the median and the other coloured lines show the k-correction as predicted by a range of Bruzual & Charlot (2003) SSP models, for various formation times (different colours) and metallicities (different line-styles) as indicated in the top-left of the figure. Bottom panel: luminosity evolution correction as a function of redshift. For clarity, we only show a few of the Bruzual & Charlot (2003) model predictions. The thick green dot-dot-dashed line shows the correction we have used in this work, which is based on the Z = 0.02 instantaneous-burst model that formed 11 Gyr ago.
Current usage metrics show cumulative count of Article Views (full-text article views including HTML views, PDF and ePub downloads, according to the available data) and Abstracts Views on Vision4Press platform.
Data correspond to usage on the plateform after 2015. The current usage metrics is available 48-96 hours after online publication and is updated daily on week days.
Initial download of the metrics may take a while.