| Issue |
A&A
Volume 578, June 2015
|
|
|---|---|---|
| Article Number | A51 | |
| Number of page(s) | 12 | |
| Section | Extragalactic astronomy | |
| DOI | https://doi.org/10.1051/0004-6361/201525849 | |
| Published online | 03 June 2015 | |
Near-infrared photometric properties of asymptotic giant branch stars in the dwarf irregular galaxy IC 1613⋆
1 Yonsei University Observatory, 120-749 Seoul, Republic of Korea
e-mail: This email address is being protected from spambots. You need JavaScript enabled to view it.
, This email address is being protected from spambots. You need JavaScript enabled to view it.
2 Choong Ang High School, 110-800 Seoul, Republic of Korea
3 Department of Astronomy, Yonsei University, 120-749 Seoul, Republic of Korea
4 Center for the Exploration of the Origin of the Universe (CEOU), Department of Physics and Astronomy, Seoul, National University, 151-742 Seoul, Republic of Korea
Received: 9 February 2015
Accepted: 21 April 2015
Abstract
Aims. We investigated the photometric properties of asymptotic giant branch (AGB) stars of the dwarf irregular galaxy IC 1613 and its metallicity.
Methods. We used near-infrared JHKs photometric data obtained with the WIRCam array on Canada-France-Hawaii Telescope (CFHT). The optical gi imaging data of a previous study were cross-matched with ours to distinguish the stellar populations in the galaxy and to select the AGB stars. We also separated the C stars from the M-giant stars in the JHKs color−color diagram.
Results. We identified 140 C stars and 306 M-giant stars in IC 1613. The (J − Ks) color histogram of AGB stars shows the main peak of M-giant stars and the red tail of C stars. The broad color distribution of M-giant stars and the isochrones in the color magnitude diagram indicate that IC 1613 has a wide range of intermediate-age stars. We also know that most C stars were formed over the past 2−8 Gyr according the Mbol-age relation. The C/M ratio of 0.46 ± 0.05 was estimated and [Fe/H] abundance of −1.23 ± 0.06 was derived from the C/M ratio. Radial distributions of C/M ratio and metallicity show the shallow trend of the negative metallicity gradient from the center. The local C/M ratio also indicates that the HI cavity has higher C/M values than the bright HI spot and HI gas region. However, the low [Fe/H] value near the central region of the galaxy is likely to be caused by the change in age of the dominant stellar population according to the radial distance, not the real metallicity variation. It might also be that relatively younger and metal-rich C stars are concentrated in the center of the galaxy, while the M-giant stars were homogeneously distributed from the center to the borders of the galaxy.
Key words: galaxies: individual: IC 1613 / galaxies: irregular / stars: AGB and post-AGB
Full Table 2 is only available at the CDS via anonymous ftp to cdsarc.u-strasbg.fr (130.79.128.5) or via http://cdsarc.u-strasbg.fr/viz-bin/qcat?J/A+A/578/A51
© ESO, 2015
1. Introduction
The studies of resolved stellar populations in galaxies provide important clues for investigating galaxy evolution, star formation, and the mean abundance of galaxies. Dwarf galaxies are the most numerous and common galaxies in the universe. The dwarf galaxies in the Local Group facilitate the study of galaxy evolution and star formation in the resolved stellar populations because they are spatially close to us (e.g., Hodge 1989; Da Costa 1998; Grebel 1999; Tolstoy 1999). In particular, gas-rich dwarf irregular galaxies are excellent laboratories in which to study the interplay between the resolved stellar population, interstellar medium, and star formation (Mateo 1998).
Among the several stellar populations in galaxies, asymptotic giant branch (AGB) stars are good objects for investigating galaxy evolution and structure because AGB stars are among the most luminous stars in the galaxy and thus are easily detectable in distant galaxies. In addition, the evolutionary phase of these stars is so sensitive to stellar age and metallicity that AGB stars are a useful indicator for understanding the formation and evolution of a galaxy. Furthermore, the AGB stars are important for studying the light from high-redshift galaxies, because distant young galaxies have a significant fraction of intermediate-age AGB stars, and thus 80% of their infrared light comes from the luminous AGB stars (Maraston 2005; Maraston et al. 2006). Thus, it is important to study the properties of AGB stars in nearby galaxies, and to understand galaxy evolution and formation.
AGB stars vary their light by pulsation, and experience a significant mass loss. They are classified into two types of stars depending on which materials are dominant in the atmosphere. During the thermal pulses (TP-AGB) process, the materials produced by triple-α reaction in the He-burning shell are mixed into the surface by a dredge-up process (Iben & Renzini 1983). The mixing process can change the dominant elements in the atmosphere from oxygen to carbon. Thus, the stars with more oxygen than carbon are known as oxygen-rich (C/O < 1) M-giant stars, while the stars with more carbon than oxygen are classified as carbon-rich (C/O > 1) C stars (Nowotny et al. 2003). The C stars generally show an extended red tail on the near-infrared color−magnitude diagram (CMD); this distinguishes them from the M-giant stars. The number ratio (C/M) between the two types of stars is used as an indirect metallicity indicator because this ratio is anticorrelated with the metal abundance (Battinelli & Demers 2005; Cioni & Habing 2005; Cioni 2009).
The source IC 1613 provides an excellent opportunity to study the history of galaxy evolution and star formation. IC 1613 is a gas-rich dwarf irregular galaxy located 730 kpc from our Sun (Dolphin et al. 2001), is isolated, and is known to have no interaction with other galaxies. Cole et al. (1999) found a significant number of old red giant stars and discussed constant star formation. More recently, Skillman et al. (2003, 2014) also confirmed that the star formation history of IC 1613 agrees with being constant over the entire lifetime of the galaxy, ruling out a dominant episode of star formation. On the other hand, Albert et al. (2000) classified 195 C stars using narrow CN and TiO band photometry data and found that the C stars were displayed up to 15′ from the center of the galaxy. Sibbons et al. (2015) also investigated the distribution of the AGB stars in IC 1613, derived an average C/M ratio, and inferred a metal abundance [Fe/H] of −1.26 ± 0.07 from the C/M ratio.
In this study, we investigate the properties of the AGB stars in the dwarf irregular galaxy IC 1613 as the fifth study in a series of the photometric properties of AGB stars in Local Group dwarf galaxies from near-infrared photometry. We have studied the near-infrared photometric properties of AGB stars in three dwarf elliptical galaxies: NGC 185, NGC 147, and NGC 205 (Kang et al. 2005; Sohn et al. 2006; Jung et al. 2012), and in one dwarf irregular galaxy: NGC 6822 (Kang et al. 2006). Section 2 introduces the near-infrared JHKs observation of IC 1613, the data reduction, and the photometry. The selection of AGB stars in IC 1613 and their photometric properties are presented in Sect .3. In Sect. 4, we discuss the distribution of AGB stars and the metallicity of the galaxy. A summary of the results is given in Sect. 5.
2. Observation, data reduction and photometric measurements
The photometric imaging data of IC 1613 were obtained by Queued Service Observing (QSO) with the WIRCam IR array on the 3.6 m Canada-France-Hawaii Telescope (CFHT) in Hawaii in July 2007. The WIRCam array is the latest wide-field near-infrared mosaic detector of four 2048 × 2048 HgCdTe arrays, which together cover an area of 21′ × 21′ with a pixel scale of  . The imaging data were recorded by a series of short exposures of 30 s in J, 15 s in H, and 25 s in Ks. Five-point dithering with 90′′ offset was applied to facilitate the rejection of bad pixels and cosmic rays, as well as to fill in the 45′′ gaps between the arrays. At each dithered point, four micro-dithered observations with a small offset of 0.5 pixels were employed to obtain well-sampled stars. Thus, total integration exposure times on the central field of IC 1613 were 600 s in J, 300 s in H and 500 s in Ks. Sky images were also obtained after observing the target images with the same observational strategy as was employed for the target galaxy. Table 1 shows the observation summary.
Observational log of IC 1613.
The obtained images were detrended (dark-subtraction, flat fielding, and removal of crosstalk, etc.) with the IDL Interpertor of the WIRCam Images (I’IWI) pipeline at CFHT. Blank-sky images were constructed by median-combining the detrended sky images to remove the thermal emission artifacts. We subtracted the resulting blank-sky images from all the target images, and the residual sky levels were also removed from the images. Then, we derived a global astrometric solution and photometric solution to calibrate the spatial distortion and chip-to-chip variations, using TERAPIX software tools (e.g., SExtractor, SCAMP, WeightWatcher, and SWarp; Bertin 2006; Bertin et al. 2002). The processed images were then co-added into one final data set with the derived astrometric and photometric solutions. Finally, we were able to obtain wide-field images of 24′ × 24′ for the JHKs filter bands, and the average seeing condition in the final images was between  . The average seeing conditions for each filter are indicated in Table 1.
The instrumental magnitudes of the stars in IC 1613 were measured by the point-spread function (PSF) fitting routines DAOPHOT II/ALLSTARS (Stetson 1987; Stetson & Harris 1988). The PSF was first constructed with 200−300 bright and isolated stars, and it was improved by removing the neighboring faint stars. Then, the instrumental magnitudes were calibrated using the stars in the Two Micron All Sky Survey (2MASS, Cutri et al. 2003) point-source catalog over the same field. We detected a total of 22 643 stars in all JHKs images on the ~24′ × 24′ field of the WIRCam observations. Then, we combined and cross-matched our calibrated magnitudes with the photometric measurements of Battinelli et al. (2007a) in optical bands to distinguish the stellar populations of IC 1613 in the color-magnitude diagrams with wide-wavelength colors (see Sect. 3.2). We obtained 13 378 stars that were in common to our photometric data and the optical data of Battinelli et al. (2007a).
The sample completeness fraction and the uncertainties of the photometric measurements were examined by performing artificial star experiments on the JHKs images. We added 400 artificial stars to each experiment to avoid increases in the amount of crowding. We added a total of 10 000 artificial stars to the JHKs images by executing 25 artificial star experiments. Figure 1 shows the results of the artificial star experiments for each JHKs image; the completeness ratio defined as the recovery rate of the input artificial stars, the rms difference in magnitudes (△ M) between the input and measured brightness, and the standard deviation of △ M(σ). The completeness ratio of each filter decreases significantly below ~90% at the levels of 21.6, 20.4, and 20.3 mag in the J,H, and Ks images, respectively. Here, we note that the stars brighter than the magnitude of the tip of the red-giant branch (TRGB), that is Ks = 18.2 (see Sect. 3.2), were used in our analysis, thus the incompleteness problem at a magnitude fainter than Ks = 18.2 does not affect our analysis.
3. Photometric properties of the AGB stars in IC 1613
3.1. Adopted reddening, distance, and metallicity range
The high Galactic latitude (b ~ − 60°) of IC 1613 provides low extinction and color excess. Several studies with optical data have provided a low-extinction value of E(B − V) = 0.02 ~ 0.04 (Sandage 1971; Freedman 1988; Cole et al. 1999) for IC 1613. The map of Schlegel et al. (1998), based on the dust infrared emission feature of the COBE and IRAS data, gives the reddening value of E(B − V) = 0.03 for IC 1613. In this study, we adopted the reddening value of Schlegel et al. (1998), and we estimated the interstellar absorptions in JHKs to be AJ = 0.025, AH = 0.016, and AKs = 0.011. Finally, these values yield the reddening values of E(J − Ks) = 0.014 and E(H − Ks) = 0.005.
The distance to IC 1613 was accurately measured from the Cepheid and RR Lyr variable stars (Sandage 1971; Freedman 1988; Saha et al. 1992). Dolphin et al. (2001) determined its distance as μ0 = 24.31 ± 0.06 (730 ± 20 kpc) from VI band photometry of the RR Lyr variables. Recently, Pietrzyński et al. (2006) measured the distance of IC 1613 more accurately from the near-infrared photometry of its Cepheid variables. They derived a distance modulus of μ0 = 24.291 ± 0.014, and we used this value in the following analysis.
 |
Fig. 1 Results of artificial star experiments on the JHKs images; the completeness ratio defined as the recovery rate of the input artificial stars (top), the rms difference magnitude (△ M) between the input magnitudes and the measured magnitudes (middle), the standard deviation of the △ M (bottom). Solid, dotted, and dashed lines indicate the J,H, and Ks bands. |
 |
Fig. 2 (J − Ks,Ks) and (H − Ks,Ks) CMDs for the resolved stars detected in near-infrared observation (upper) and for the commonly detected stars in the near-infrared and optical data of Battinelli et al. (2007a) (lower). The magnitude and color range of TRGB (Valenti et al. 2004) for the given metallicity of [Fe/H] = −1.75 ~ − 1.3 is indicated by the solid line. The estimated magnitude in Ks of TRGB in this study is indicated by an arrow at Ks = 18.2. The open circles are 82 C stars cross-identified in both the giJHKs photometry (this study) and CNTiO photometry of Albert et al. (2000). |
IC 1613 has a rich old- and intermediate-age population, and several studies have reported a low metallicity [Fe/H] = −1.3 for this population. Freedman (1988) determined its metallicity as [Fe/H] = −1.3 ± 0.8 from the RGB population. Cole et al. (1999) also estimated a mean metallicity of the intermediate-age stellar population [Fe/H] = −1.38 ± 0.31 from the (V − I) color of the RGB population. Tikhonov & Galazutdinova (2002) reported a somewhat lower metallicity of [Fe/H] = −1.75 ± 0.2 for the RGB population with an old age of ~10.1 Gyr. Using HST photometry data, Skillman et al. (2003) found a broad metallicity range of −1.3 < [Fe/H] < − 0.7. Recently, Zucker & Wyder (2004) measured the metal abundance of the RGB stars in IC 1613 using the DEMIOS data from the Keck Telescope. They derived a metallicity of [Fe/H] = −1.3 from the CaII triplet line.
3.2. Determining the magnitude of TRGB and selecting the AGB stars
Figure 2 presents the (J − Ks,Ks) and (H − Ks,Ks) CMDs for the resolved stars (upper) in IC 1613 and for the commonly detected stars (lower) in our data and the optical data of Battinelli et al. (2007a). Valenti et al. (2004) derived the empirical relationships between the magnitude of TRGB in the near-infrared bands and the metallicity in a galaxy. We estimated the position of the magnitudes and colors of TRGB using relationships of Valenti et al. (2004) for a given metallicity range of [Fe/H] = −1.75 ~ − 1.3. The solid line in Fig. 2 indicates the TRGB range of Valenti et al. (2004) calibrated by the adopted distance modulus of IC 1613. In Fig. 2, the most prominent stellar component is the RGB population, which is fainter than the magnitude range of TRGB. The supergiant stars in IC 1613 create a sequence vertically from J − Ks ~ 0.75 to ~1.5 and up to Ks ~ 13.6. The bright blue part of these stars is contaminated by the Galactic foreground field stars. The AGB stars of M-giant and C stars show a red tail that extends horizontally redward of J − Ks ~ 0.8 and near the magnitude range of TRGB. The faintest area of the AGB stars was also polluted by supergiant and bright RGB stars. Thus, a clear separation between the RGB, AGB, and supergiant stars is necessary to study the AGB population.
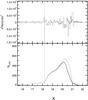 |
Fig. 3 Lower panel: luminosity function in Ks for the stars in the giJHKs photometry of IC 1613. The black solid line is the number of stars in the 0.065 mag bin, and the gray solid line is the completeness-corrected number of stars. Upper panel: the second derivatives of the observed and the completeness-corrected LF. The vertical dotted line at Ks = 18.2 indicates the detected magnitude of the TRGB discontinuity and its peak. |
As a first step to remove the contamination in the AGB stars, we estimated the magnitude of the TRGB of IC 1613 and assigned this value as a limited magnitude of the AGB stars. The TRGB is a sharp discontinuity in the evolutionary track of stars caused by the violent onset of core helium burning in low-mass stars. This causes an abrupt discontinuity in the luminosity function (LF) of bright stars, and this discontinuity can be a primary distance indicator. Cioni et al. (2000) suggested that the discontinuity of TRGB in LF can be easily detected as a peak in the second derivative of the observed LF. Thus, we applied the procedure of Cioni et al. (2000) to determine the magnitude of TRGB. A Savitzky-Golay filter was applied to the observed LF to derive the second derivative of the observed LF. The procedure of the Savitzky-Golay filter method for an observed LF was described in detail by Jung et al. (2012). The lower panel of Fig. 3 shows the LF in Ks for the stars in giJHKs photometry, and its second derivative is plotted in the upper panel of Fig. 3. The mag bin of 0.065 in Ks was used when we derived the LF. We detected the discontinuity of the TRGB and its peak at Ks = 18.2 in LF and in the second derivative of LF. We preselected stars brighter than the magnitude of TRGB, that is, Ks = 18.2, as the AGB star candidates.
In Fig. 2, the region of stars brighter than the magnitude of TRGB is a composite of three different components: the Galactic foreground stars, supergiants, and AGB stars in IC 1613. The separation into faint magnitude between the supergiant stars and AGB stars is not obvious in near-infrared color. Thus, we examined the distribution of the AGB star candidates on the CMDs of the photometric parameters with a wide wavelength baseline through the optical (gi) to infrared (JHKs). Figure 4 shows the CMDs with the color indices of gi minus JHKs bands and gi magnitudes for the stars that are commonly detected in infrared and optical data. The AGB star candidates brighter than the TRGB magnitude, which corresponds to the slanted lines in the (g − Ks,g) CMD, are indicated by the painted points. Figure 4 shows that the resolved stars are widely distributed in the color index with a long wavelength range. Indeed, three different components of the AGB star candidates, such as the Galactic foreground stars, supergiants stars, and AGB stars, are clearly distinguishable in the (g − Ks,g) CMD. From the luminosity function in g magnitude, we empirically assigned the separation line between the supergiant stars and the AGB stars. The magnitude of g = 22.2, which is indicated as a straight gray line in the (g − Ks,g) CMD, was selected from the discontinuity of the luminosity function in g magnitude. It is evident that the straight gray line of g = 22.2 is located at the plume of AGB stars. We describe the isochrones (Girardi et al. 2010) for the metallicity of Z = 0.001 with age of log (tyr) = 9.0,9.4 in the (g − Ks,g) CMD. The isochrones of AGB stars also demonstrate that our assignment of separating magnitude between supergiant and AGB stars is appropriate. We considered the stars brighter than the magnitude of TRGB and g> 22.2 as AGB stars. The blue limit of the AGB stars was empirically determined based on the color distribution of the AGB stars (Battinelli et al. 2007b). The final conditions applied for the selection of AGB stars were Ks< 18.2, g> 22.2, (J − Ks) > 0.88, (J − H) > 0.6, and (H − Ks) > 0.15 mag. We obtained 446 AGB stars with these selection criteria. Although we removed the contaminations in the AGB stars using several color and magnitude criteria, there is still a possibility that some Galactic foreground stars remain in our final selected AGB stars. We estimated the remaining foreground contamination from the synthesized foreground stars in the direction of IC 1613 using TRILEGAL (Girardi et al. 2005). We applied our selection criteria for AGB stars to the simulated foreground stars and found that the potential contamination of foreground stars is about 2% of our final selected AGB stars. The sky position and magnitude of AGB stars along with the photometric error are given in Table 2. The first column shows the identification number of the observed star. The next two columns contain the sky position of the AGB stars in right ascension (RA) and declination (Dec). In Cols. 4 and 5, we present the magnitude in J band and its photometric error. The same information for the H band and Ks band is indicated in Cols. 6 to 9. The last column indicates whether it is a C star or an M-giant star.
The (J − Ks,Ks) CMD of the bright stellar populations in IC 1613 was examined with theoretical isochrones of the AGB stars (Girardi et al. 2010; Bressan et al. 2012). Figure 5 shows the (J − Ks,Ks) CMD of stars brighter than Ks = 18.2 compared with the isochrones of two metallicities of Z = 0.001,0.008 and several ages. We note that the isochrone of Bressan et al. (2012) has no thermal pulsing (TP) AGB, thus the isochrone of the pre-TP-AGB was plotted. In Fig. 5, the most luminous AGB stars seem to have an age of ~400 Myr (log (tyr) = 8.6) and ~1 Gyr (log (tyr) = 9.0) according to the two isochrones with low and high metallicities. In the upper panel with low metallicity (Z = 0.001) of Fig. 5, the majority of AGB stars (M-giant stars) is explained by the isochrone with an age of log (tyr) = 9.4, while the AGB star population also has an age of log (tyr) = 9.0 and 10.0 in the lower panel with high metallicity (Z = 0.008). In this respect, at a given metallicity (preferably Z = 0.001 because of the low metallicity of IC 1613), the M-giant stars seem to be older than the C stars. Although the widespread distribution of the AGB stars reflects the several ages and metallicities of the AGB populations in IC 1613, the isochrones with low and high metallicity indicate that the common age ranges of the AGB stars in IC 1613 are from log (tyr) = 9.0 to 10.0. Marginally, the brightest AGB stars seem to have an age of log (tyr) = 8.6.
3.3. Color−color diagrams and the selection of the C stars of IC 1613
AGB stars with spectral type C have redder colors than the M-giant stars, resulting in a broad distribution in the form of a red tail in the near-infrared CMDs. The extreme red color of C stars is caused by the increasing molecular opacity at the atmosphere of the stars as material such as carbon is dredged up by TP (Marigo et al. 2003). The steep temperature gradient of the C stars enables us to separate them from the M-giant stars by using the distribution of the stars on the CMD or the color−color diagram (CCD).
 |
Fig. 4 CMDs with the color indices of gi minus JHKs band and gi magnitudes. The colored dots are the stars that are brighter than the TRGB magnitude (Ks = 18.2), which corresponds to the slanted line in the (g − Ks,g) CMD. The Galactic foreground and supergiants stars are indicated by the blue and orange dots, respectively. The green and red dots correspond to the M-giant and C stars. The red curves in the (g − Ks,g) CMD are isochrones (Girardi et al. 2010) for the metallicity of Z = 0.001 with an age of log (tyr) = 9.0,9.4. |
Sky position, magnitudes, and photometric errors in J, H, and Ks band for the identified AGB stars in IC 1613.
We investigated the distribution of the AGB stars in the (H − Ks) − (J − Ks) CCD to separate the C stars. Figure 6 shows the (H − Ks) − (J − Ks) CCD and color histograms of (H − Ks) and (J − Ks) for the selected AGB stars. Figure 6 shows that the peak and bulk of the color histograms are related to the M-giant stars and the tail at the red end contains the C stars. The color separations of the C stars from the M-giant stars were determined at (H − Ks) > 0.45 and (J − Ks) > 1.28, where the histogram of M-giant stars drops significantly. The applied color limit in (J − Ks) of the C stars is somewhat bluer than the color limit of (J − K)0 = 1.4 used in several previous studies (Davidge 2005; Kang et al. 2006; Battinelli et al. 2007b; Battinelli & Demers 2009). We note that spectroscopic data are necessary for a more accurate identification of M-giant and C stars. However, Battinelli & Demers (2009) discussed that many C stars probably have a bluer color than the (J − K)0 = 1.4 limit, and Kacharov et al. (2012) indeed found in their spectroscopic data of NGC 6822 that several of the C stars in NGC 6822 have a bluer color than this limit. Thus, our color limit for the C stars is reasonable compared with the other conditions. For an accurate classification of M-giants and C stars, photometric narrow-band data such as CM and TiO or spectroscopic data are necessary. Finally, 140 C stars were selected from the CCD and color histograms for the observed 446 AGB stars of IC 1613.
 |
Fig. 5 (J − Ks,Ks) CMD of stars brighter than Ks = 18.2 with the theoretical isochrones of log (tyr) = 8.6,9.0, and 9.4 with Z = 0.001 (upper panel) and log (tyr) = 8.6,9.0, and 10.0 with Z = 0.008 (lower panel). The notations of the observed stellar population are the same as those in Fig. 4. The isochrones of Girardi et al. (2010) (solid line) and Bressan et al. (2012) (dotted line) are used to compare the stellar populations in IC 1613. The black lines correspond to the pre-TP-AGB stars, and the blue and red lines represent M-giants and C stars, respectively. |
 |
Fig. 6 (H − Ks) − (J − Ks) CCD for the selected AGB stars and the color distributions of (H − Ks) (upper panel) and (J − Ks) (right panel). The dotted lines indicate the separation color limit between the M-giants and C stars. The green and red dots are the identified M-giants and C stars. The open circles indicate 82 C stars cross-identified in both the giJHKs photometry (this study) and CNTiO photometry of Albert et al. (2000). |
4. Discussion
We identified 140 C stars and 306 M-giant stars in the selected AGB stars of IC 1613 by examining the color−color diagram. In the following section, we discuss the properties of the C stars and M-giant stars. The color distribution and luminosity function of both stellar populations are investigated, and the number ratio between the C stars and the M-giant stars (C/M) is also estimated according to the spatial location of IC 1613.
 |
Fig. 7 (J − Ks) and (H − Ks) color distribution for the selected 446 AGB stars (upper panel) and 306 M-giant stars (bottom panel) in IC 1613. The peak of the color histogram for the AGB stars is described by a Gaussian function with standard deviation (σ). Black arrows indicate the theoretical (J − Ks) colors at MKs = −7.0 in the Girardi et al. (2010) isochrones with Z = 0.008 and ages of log (tyr) = 8.6,9.0, and 10.0, while red arrows show the (J − Ks) colors of isochrones with Z = 0.001 and ages of log (tyr) = 8.6,9.0, and 9.4. |
4.1. Color distribution and luminosity function of the AGB stars
The color distribution of AGB stars can be used to infer the range of age and metallicity for the AGB stars in galaxies. We investigated the color distributions of (J − Ks) and (H − Ks) for the selected AGB stars in IC 1613, and the results are shown in the upper panel of Fig. 7. In Fig. 7, it is apparent that the M-giant stars contribute to the main peak in the color histogram, which is described by the Gaussian function with the standard deviation (σ) in the (J − Ks) and (H − Ks) colors, while the C stars comprise the red tail in the color histogram. The broad color distribution of the AGB stars indicates that the AGB stars have a wide range of ages and metallicities.
In our previous studies (Kang et al. 2005, 2006; Sohn et al. 2006; Jung et al. 2012), the age ranges for the AGB stars in NGC 185, NGC 147, NGC 6822, and NGC 205 were inferred: two epochs of star formation with log (tyr) ~ 9.0 − 9.4 and 7.8 − 8.5 for NGC 185 (Kang et al. 2005), a range of age with log (tyr) ~ 8.2 − 8.6 for NGC 147 (Sohn et al. 2006), a range of age with log (tyr) ~ 8.0 − 10.0 for NGC 6822 (Kang et al. 2006), and an epoch of age with log (tyr) ~ 9.0 − 9.7 for NGC 205 (Jung et al. 2012). Davidge (2005) also examined the age range for the M-giant stars in NGC 147, NGC 185, and NGC 205 by comparing the (J − K) and (H − K) color distributions of the M-giant stars between −7.6 <MK< − 7.2 with the color values at MK = −7.4 of the theoretical Girardi et al. (2002) isochrones with ages of log (tyr) = 8.1,9.0, and 9.8. We also compared the color distribution of the M-giant stars with the theoretical isochrone. The lower panels of Fig. 7 show the (J − Ks) and (H − Ks) color histograms with a 0.05 mag bin size for the M-giant stars in IC 1613. We restricted the brightness range of the M-giant stars with −7.4 <MK< − 6.4. We adopted a distance value of μ0 = 24.291 ± 0.014 (Pietrzyński et al. 2006) and an E(B − V) value of 0.03 (Schlegel et al. 1998) to transform the apparent magnitude into the absolute magnitude. In Fig. 7, black arrows indicate the (J − Ks) color values at MKs = −7.0 in the Girardi et al. (2010) isochrones with Z = 0.008 and ages of log (tyr) = 8.6,9.0, and 10.0, while red arrows indicate (J − Ks) color values of isochrones with Z = 0.001 and ages of log (tyr) = 8.6,9.0, and 9.4. Thus, we found that the M-giant stars in IC 1613 have common age ranges with log (tyr) ~ 9.0 − 10.0, with a peak of log (tyr) = 9.0 in both metallicities.
 |
Fig. 8 Left panel: completeness-corrected LFs in the MKs for the C stars (upper) and M-giant stars (lower) in IC 1613. The smaller box in the lower panel shows the logarithmic LF of the M-giant stars. Right panel: completeness-corrected bolometric LFs for the C stars (upper panel) and M-giant stars (lower panel). The luminosities of the AGB tip with ages of 3,5,8, and 10 Gyr obtained from the Mbol-age relation of Rejkuba et al. (2006) are indicated as thick lines. |
The luminosity function (LF) for the resolved AGB stars in a galaxy is a useful method for comparing the observational results with the evolutionary models of AGB stars. In addition, the bolometric LF and the mean bolometric magnitude of C stars in a galaxy depend on the metallicity and star formation history of the galaxy (Groenewegen et al. 1999; Nowotny et al. 2003). In particular, the LF of AGB stars in a galaxy from near-infrared data is more advantageous than those from optical band images, as some red bright stars are not detected in optical images (Freedman 1992; Jackson et al. 2007).
The completeness-corrected LFs in the MKs magnitude for the C stars and M-giant stars in IC 1613 are plotted in the left two panels of Fig. 8. The shape of the LF for the C stars shows an almost Gaussian distribution, and the mean absolute magnitude is ⟨ MKs ⟩ = −7.42 ± 0.46. The Gaussian distribution of the C stars in IC 1613 is consistent with our previous result of dwarf irregular galaxy NGC 6822, but inconsistent with the results of dwarf elliptical galaxies NGC 147, NGC 185, and NGC 205. We plot the completeness-corrected logarithmic LF in the MKs of the M-giant stars in the small inner panel of the lower left panel of Fig. 8. The logarithmic slope of the MKs LF for the M-giant stars was measured to be 1.59 ± 0.26 by performing a least-squares fit to the magnitude of −7.7 <MKs< − 6.8. The slope of the LF for the M-giant stars in IC 1613 is comparable with the slope of 1.12 ± 0.03 for NGC 6822 (Kang et al. 2006), but is much steeper than our previous results of slopes for dwarf elliptical galaxies, that is, 0.79 ± 0.02 for NGC 147 (Sohn et al. 2006), 0.83 ± 0.02 for NGC 185 (Kang et al. 2005), and 0.84 ± 0.01 for NGC 205 (Jung et al. 2012). This comparison indicates that the dwarf irregular galaxies probably have a star-forming history for M-giant stars different from that of dwarf elliptical galaxies.
The completeness-corrected bolometric LFs of the C stars and M-giant stars are plotted in the right two panels of Fig. 8. We derived the bolometric correction value in the K band (BCK) for the C stars and M-giant stars in IC 1613 from the empirical relationships between the BCK and (J − K) for the Galactic and LMC AGB stars. The relationships for the M-giant stars in the LMC and the Galaxy given by Bessell & Wood (1984) and the relationships for the Galactic C stars given by Costa & Frogel (1996) were used for the M-giant and C stars in IC 1613, respectively. The average bolometric correction values in the K band (BCK) for the C stars and M-giant stars are 3.14 and 2.79, respectively. However, we also note that it is not clear that the BC values obtained from the relation for the Galactic and LMC stars are appropriate to the lower metallicity of AGB stars in IC 1613, and thus accurate BC values for IC 1613 are necessary. In the right panels of Fig. 8, the bolometric LF of the M-giant stars extends to Mbol = −4.5, and that of the C stars spans −5.7 <Mbol< − 2.8. The average bolometric magnitude of the C stars is ⟨ Mbol ⟩ = −4.28 ± 0.47, which is comparable with those of C stars in dwarf galaxies, that is, ⟨ Mbol ⟩ = −4.50 ± 0.42 in NGC 185 (Kang et al. 2005), ⟨ Mbol ⟩ = −4.32 ± 0.49 in NGC 147 (Sohn et al. 2006), ⟨ Mbol ⟩ = −4.24 ± 0.55 in NGC 205 (Jung et al. 2012), and ⟨ Mbol ⟩ = −4.36 ± 0.54 in NGC 6822 (Kang et al. 2006).
4.2. Spatial distributions of the C and M-giant stars, C/M ratio, and metallicity
The number ratio of C stars to M-giant stars (C/M) is traditionally used to provide an indirect estimate of the metallicity at the time these AGB stars formed (Mouhcine & Lançon 2003), as this ratio is anticorrelated with the metal abundances: a higher C/M ratio means lower metal abundances. This anticorrelation between C/M ratio and metallicity is explained by two metallicity effects on the evolution of stars (Blanco et al. 1978; Scalo & Miller 1981; Iben & Renzini 1983): (1) at lower metallicities the stars in a giant branch shift to a higher temperature because of low opacity, thus the oxygen-rich stars with lower metallicities will have a higher temperature than the M stars temperature range; and (2) oxygen-rich stars easily become carbon-rich stars in a lower metallicity environment because fewer carbon atoms are necessary in dredge-up events to transform the oxygen-rich atmosphere into a carbon-rich atmosphere. Several studies provided the calibrations of the relation between the C/M ratio and [Fe/H] (Battinelli & Demers 2005; Cioni & Habing 2003, 2005) from several nearby galaxies.
However, recent observational and theoretical studies raised some doubt about the C/M ratio as a metallicity indicator. Mouhcine & Lançon (2003) and Feast et al. (2010) reported that the C/M ratio is much more dependent on the age of the populations. The star formation histories of C star and M-giant stars were investigated by Gullieuszik et al. (2008) and Held et al. (2010). They found that most of the AGB stars younger than ~6.5 Gyr evolved into C stars with the highest production rate in the last 1 ~ 2 Gyr, while the number of C stars significantly decreased after 7 ~ 8 Gyr. The dependence of C stars on age is due to the fact that the stars in a specific mass range can only evolve to the thermal-pulsing AGB phase (TP-AGB) after a certain age, and hence become C stars through the third dredge-up. Karakas (2003) suggested that AGB stars that are more massive than 1 ~ 1.5 M⊙ could become C stars. Kalirai et al. (2014) calculated the third dredge-up efficiency at metallicity Zinitial = 0.02 as a function of stellar mass and derived that stars with Minitial ≥ 2 M⊙ experience third dredge-up and become C stars. Thus, the interpretation of the C/M ratio can be more complicated because of the dependence of C stars on age and metallicity along with the degeneracy between age and metallicity. For example, according to the traditional relationship between the C/M ratio and metallicity, younger AGB populations are more metal-rich than old AGB populations and thus have a lower C/M ratio. However, the young and metal-rich AGB stars with a certain mass, over which C stars are expected to evolve, could have a higher C/M ratio within a few Gyr, while the old and metal-poor AGB stars, which have not enough mass to evolve into C stars because of old age, would have a lower C/M ratio. Therefore, it is necessary to investigate the relation between the C/M ratio and metallicity, which takes the dependence of C stars on age into account. Unfortunately, we did not have enough observational data to examine the dependence of C stars on age. Thus, we just followed the conventional relationship between the C/M ratio and metallicity and noted a possibility of age effect on our results.
From the identified C stars and M-giant stars, we estimated the average C/M ratio of 0.46 ± 0.05 for the WIRCam observed field of IC 1613. Our C/M ratio is lower than the previous result of 0.64 (Albert et al. 2000), while is consistent with 0.52 ± 0.04 (Sibbons et al. 2015) when we consider the 1σ error. We attribute the difference between our results and the previous results to the method for defining the M-giant stars and C stars and the difference in the observed field of view for IC 1613. We discuss this in the next subsection. The global metallicity of [Fe/H] = −1.23 ± 0.06 for IC 1613 was estimated from the relation between the C/M ratio and metallicity developed by Cioni (2009). This metallicity value is not much different from the previous results for the metallicity of IC 1613 (Freedman 1988; Cole et al. 1999; Zucker & Wyder 2004). More recently, Sibbons et al. (2015) also derived the metallicity of [Fe/H] = −1.26 ± 0.07 for IC 1613 from their C/M ratio. In our previous studies, the C/M ratios of three dwarf elliptical galaxies and one dwarf irregular galaxy were estimated as 0.11 ± 0.01 for NGC 185 (Kang et al. 2005), 0.16 ± 0.02 for NGC 147 (Sohn et al. 2006), 0.15 ± 0.01 for NGC 205 (Jung et al. 2012), and 0.27 ± 0.03 for NGC 6822 (Kang et al. 2006). We note that Sibbons et al. (2012) estimated the C/M ratio for NGC 6822 with different criteria for the selection and identification of the AGB populations and found that this value was 0.62 ± 0.03. According to the results of our studies and those reported by Sibbons et al. (2012) study, the C/M ratios of dwarf irregular galaxies seems to be higher than those of dwarf elliptical galaxies. Although our data samples are not large enough to draw a definite conclusion, this result would indicate that the metallicity of dwarf irregular galaxies is systematically lower than that of dwarf elliptical galaxies. We note that at the same luminosity, dwarf elliptical galaxies have a higher metallicity than dwarf irregular galaxies (Richer & McCall 1995).
 |
Fig. 9 Distributions of C stars (filled dot) and M-giant stars (open triangle) over the VLA HI map of Lozinskaya et al. (2001). The five circles with 2 arcmin in radius were arbitrarily selected to investigate the local C/M ratio variations. |
 |
Fig. 10 Radial distribution of the C/M ratio from the center of the HI cavity and the inferred [Fe/H] of IC 1613 according to the relation between the C/M ratio and metallicity by Cioni (2009). |
The C/M ratio of a galaxy is also used to examine the metallicity variations across the galaxy. Figure 9 shows the distributions of the identified C stars and M-giant stars over the VLA HI map of IC 1613 (Lozinskaya et al. 2001). As shown in the results of Lake & Skillman (1989), it is apparent that there are a large cavity of HI in the center of the galaxy and a very bright HI spot in northeastern region. Neither C stars nor M-giant stars show a significant spatial coherence over the HI distribution map. However, the M-giant stars seem to be homogeneously distributed beyond the HI distribution, while the C stars appear to be concentrated in or around the HI cavity. Thus, we investigated the C/M ratio variation as a function of radial distance from the center of the HI cavity. We divided the observed sky region of IC 1613 into six annuli with 2 arcmin width. Figure 10 shows the radial distributions of the C/M ratio and inferred [Fe/H] of IC 1613. There is a shallow trend of a negative metallicity gradient with increasing radial distance. The slope of −0.016 ± 0.008 for the C/M ratio gradient (0.006 ± 0.003 for the [Fe/H] gradient) indicates that the negative metallicity gradient in IC 1613 is not significant. However, more metal-rich stars are typically concentrated in the central region, and an age effect on the C/M ratio or other parameters could affect the C/M ratio in IC 1613. Thus, we note that the observed C/M ratio trend of IC 1613 would not reflect the metallicity gradient alone, and therefore no gradient or a shallow negative metallicity gradient in a galaxy needs a more detailed investigation.
We estimated the local number counts of the C stars and M-giant stars according to the HI distribution to investigate the spatial correlation between the C/M ratio and HI distribution. In Fig. 9, five fields with 2 arcmin in radius were selected: one HI cavity in the center (A), the second HI cavity in the northern part of the galaxy (B), the area of the brightest HI spot (C), and the counterpart area to the second HI cavity and bright HI spot (D, E). The estimated number counts of the C stars and M-giant stars and the C/M ratios for the five fields are indicated in Table 3. The two HI cavities (fields A and B) have high C/M ratios, while the bright HI spot (C) has the lowest C/M ratio. However, the C/M ratios in the fields B and C have a large error because of the low number counts, thus it is unclear whether these C/M ratio values in the two fields are correct. The remaining two HI regions seem to have lower C/M ratios than that of HI cavities in the center. Thus, although the C/M ratios in the five fields have an error so high that it is difficult to draw a definite conclusion, the C/M ratios of the HI gas (D and E) overall seem to be somewhat lower than that of the HI cavity (A). The spatial distribution of the C stars and M-giant stars in IC 1613 might be associated with the HI envelope and its star formation activity.
Several previous researchers have studied the star formation history and star formation rate of IC 1613. Cole et al. (1999) suggested that there has been a constant and continuous star formation in IC 1613 from the analysis of the AGB stars. Lake & Skillman (1989) reported that they found no significant recent star formation in the center of IC 1613. Recently, Skillman et al. (2014) also drew the same conclusion: that the star formation history of IC 1613 has been constant over the entire lifetime of the galaxy, and there was no early dominant star formation. Thus, we know that the center of IC 1613 has not had any dominant star formation recently, but it has continuously formed stars constantly over a long period of time. The high value of the C/M ratio in the central area of IC 1613 would be the result of such continuous and constant star formation history.
The luminosity of the AGB stars can be used to estimate their ages. In AGB evolutionary stage, the lifetime of AGB is so short that the brightness of the most luminous AGB stars can be used to estimate the initial mass of stars as well as their ages (Iben & Renzini 1983). Furthermore, at a given metallicity, the brightness and color of the AGB stars in the CMD have no degeneracy in age. Mould & Aaronson (1982) found that the luminosity extent of the AGB stars can be used as an indicator of stellar age: the brighter the tip of the AGB, the younger the stellar populations. Rejkuba et al. (2006) also found an empirical relationship between age and absolute bolometric magnitude of AGB tip. We note that the bolometric magnitude of the AGB tip also depends on the metallicity, but the effect of metallicity is much waker than that of age. Crnojević et al. (2011) investigated the effects of age and metallicity on the bolometric luminosity of the AGB tip using the stellar evolutionary model at a fixed age (e.g., either 2, 4, 6, or 9 Gyr), and then found that the difference in bolometric luminosity of the AGB tip in several metallicities (Z = 0.0006, 0.0019, and 0.006) is only ~0.2 mag.
Number counts and local C/M ratio of IC 1613.
We also investigated the age of the AGB stars we identified in our observation. In Fig. 8, we indicate the luminosities of the AGB tip with ages of 3,5,8, and 10 Gyr obtained from the Mbol-age relation of Rejkuba et al. (2006). It is apparent from Fig. 8 that IC 1613 has formed substantial numbers of AGB stars over the entire lifetime of the galaxy, and the majority of the C stars formed over the past 2−8 Gyr. This time period is when the AGB stars evolve into C stars with the highest production rate, according to previous studies (Gullieuszik et al. 2008; Held et al. 2010). We can infer that the majority of the AGB stars in IC 1613 are now in the phase of evolving into C stars. The mean magnitude of the four most luminous AGB stars is about Mbol = −5.46 ± 0.13, which indicates that the last star formation episode was less than 3 Gyr ago according to the relation of Rejkuba et al. (2006). The obtained magnitude value is similar to or brighter than the brightness of the AGB tip of Fornax galaxy (Demers et al. 2002). Rejkuba et al. (2006) reported that the age of last star formation for Fornax was 300 ~ 400 Myr ago based on the magnitude of the AGB tip, thus the age of last star formation episode for IC 1613 seem to be similar to that of Fornax. The young age of bright AGB stars is also consistent with the isochrone of log (tyr) = 8.6 in CMD of Fig. 5. From a comparison of the AGB stars with isochrones in the CMD of Fig. 5 in the Sect. 3.2, we mentioned that M-giant stars seem to be older than C stars. In Fig. 8, C stars also seem overall to be younger than the M-giant stars. Thus, C stars probably are relatively more metal-rich than the old M-giant stars and be more concentrated in the central region of the galaxy. This would mean that the high value of the C/M ratio in the central region of IC 1613 does not reflect the real metallicity feature of IC 1613. The age effect of C stars on the C/M ratio, the concentration of metal-rich C stars with ages of 2 − 8 Gyr, might cause the high C/M ratio in the central region of the galaxy and lead to an incorrect estimate of metallicity feature. To confirm the age effect on the C/M ratio, abundance information of the AGB stars from spectroscopy and modeling of the star formation are necessary.
 |
Fig. 11 Cumulative radial distributions of C stars (dotted line) and M-giant stars (solid line) of IC 1613 from the center of the HI cavity. We also plot the cumulative radial distribution of red supergiant stars (dashed line) that were misidentified as M-giant stars in re-identified AGB stars. The K-S test probability is also indicated. |
We investigated the cumulative radial distribution of the C stars and M-giant stars to confirm the concentration of C stars in the central region of IC 1613. Figure 11 shows the cumulative radial distributions of the C stars and M-giant stars. It seems that the C stars are more concentrated than the M-giant stars in the central region of IC 1613. A Kolmogorov-Smirnov (K-S) test gives a probability of about 0.32, which indicates the probability of falsely rejecting the null hypothesis that the two populations have the same cumulative distributions. This would mean that the two populations may have a different distribution in the galaxy and that the C stars are more concentrated than the M-giant stars. However, since the spatial resolution is not sufficient, more accurate and higher resolution photometric data are needed to confirm the concentration of C stars in the galaxy.
4.3. Importance of the selection criteria for C stars and M-giant stars
Recently, Sibbons et al. (2015) investigated the AGB stars in IC 1613 using near-infrared imaging data obtained from UKIRT. They identified 843 AGB stars of which they classified 291 as C stars and 552 as M-giant stars. Their estimated C/M ratio was 0.53, which is higher than our C/M ratio. One of the most interesting results reported by Sibbons et al. (2015) is the radial distribution of the C/M radio and the inferred metallicity with a positive radial gradient, which is in contrast to our result. The differences between our results and those of Sibbons et al. (2015) seem to be due to the different methods and color limits that were used to identify of AGB stars in a galaxy.
We re-identified the AGB stars and classified the C stars and M-giant stars according to the selection criteria of Sibbons et al. (2015). We were able to identify 702 AGB stars: 460 M-giant stars and 242 C stars. The C/M ratio from the re-identified AGB stars is 0.53 ± 0.04, which is almost the same as the result of Sibbons et al. (2015). However, we were able to find that a considerable number of stars (about 30%) among the 460 re-classified M-giant stars were highly red supergiant stars. That red supergiant stars were misidentified as M-giant stars with the selection criteria of Sibbons et al. (2015) was also noted in the study of Sibbons et al. (2015). Here we note that we removed the red supergiant stars from our original M-giant star group in the (g,g − Ks) CMD using the optical imaging data (see Sect. 3.2). We also found that these red supergiant stars, which are misidentified as M-giant stars in re-identified AGB stars, are concentrated in the center of the galaxy. We plot the cumulative radial distribution of the red supergiant stars misidentified as M-giant stars in Fig. 11. It is evident that the red supergiant stars are concentrated in the central region of galaxy. Thus, if we do not remove the red supergiant stars from the M-giant stars group, the radial distribution of the C/M ratio would show a low C/M ratio in the central region of the galaxy. Indeed, the radial distributions of the C/M ratio obtained from the classified C stars and M-giant stars according to the selection criteria of Sibbons et al. (2015) show a similar tendency to the result of Sibbons et al. (2015). Thus, we should keep in mind that different methods for identifying AGB stars and different selection criteria can cause different results and interpretations. A more accurate method for identifying of AGB stars and classifying of the C stars and M-giant stars is necessary, for which the abundance information of AGB stars from spectroscopy is needed.
5. Summary
We have investigated the properties of AGB stars in the dwarf irregular galaxy IC 1613 using the JHKs photometry imaging data obtained from the WIRCam CFHT. The magnitude of the TRGB was determined, and the AGB stars of IC 1613 were identified. We also further classified the C stars and M-giant stars in the AGB stars. Our main results are summarized as follows.
-
1.
A TRGB magnitude ofKs = 18.2 was estimated from the luminosity function of the RGB stars using the Savitzky-Golay filter. The magnitude of the TRGB was used to identify AGB stars as the faintest limit. We assumed that the AGB stars were more luminous than this value.
-
2.
Our photometric measurements were cross-matched with the optical data of Battinelli et al. (2007a), and we identified 13 378 stars in common. From the CMDs with the color indices of gi minus JHKS band and gi magnitude, we were able to classify the stellar populations in the field of IC 1613 and remove the foreground Milky Way stars and supergiant stars in IC 1613. We selected a total of 446 AGB stars using the color selection criteria of (J − Ks) > 0.88, (J − H) > 0.6, and (H − Ks) > 0.15. Then, 140 C stars and 306 M-giant stars were separated at (H − Ks) = 0.45 and (J − Ks) = 1.28 on the CCD.
-
3.
The (J − Ks) color histogram contains the main peak of the M-giant stars and the red tail of the C stars. The broad color distribution of the M-giant stars and the isochrone in CMDs indicate that IC 1613 has a range of intermediate-age stars from log (tyr) = 9.0 to 10.0. The brightest AGB stars seem to have an age of log (tyr) = 8.6 The logarithmic slope of the MKs LF was estimated to be 1.59 ± 0.26. The MKs and bolometric LFs of the C stars show Gaussian distributions, and the majority of the C stars were formed over the past 2−8 Gyr according to the Mbol-agb relation of Rejkuba et al. (2006).
-
4.
The C/M ratio over the observed field of IC 1613 was measured to be 0.46 ± 0.05. We derived an [Fe/H] abundance of −1.23 ± 0.06 from the C/M ratio by using the relation of Cioni (2009). We also investigated the radial distribution of the C/M ratio and inferred [Fe/H] from the center of the HI cavity in the central region of the galaxy, from which we found a shallow trend of a negative metallicity gradient. However, it seems more likely that this is due to the change in age of the dominant stellar population according to the radial distance. We found that relatively younger and metal-rich C stars might be concentrated in the center of the galaxy, while the M-giant stars show a homogeneous distribution from the center to the border regions of the galaxy. The local C/M ratios indicate that the HI cavity in the central region of the galaxy has higher C/M values than the HI gas regions.
-
5.
There are, however, a number of problems that remain to be investigated. The methods of identification and classification of the AGB stars can affect the results of the C/M ratio and its interpretation. Furthermore, the age dependence of the C/M ratio needs to be investigated in more detail. Abundance information of the AGB stars from spectroscopy and detailed modeling of the star formation of the galaxy are necessary to solve the negative metallicity gradient and the age-metallicity degeneracy.
Acknowledgments
We are grateful to an anonymous referee for detailed comments that greatly improved this paper. We are grateful for support from the KASI-Yonsei DRC program of the Korea Research Council of fundamental Science and Technology (DRC-12-2-KASI). This research was partially supported by the Basic Science Research Program through the National Research Foundation of Korea (NRF) funded by the Ministry of Education, Science and Technology (2013R1A1A2006826).
References
- Albert, L., Demers, S., & Kunkel, W. E. 2000, AJ, 119, 2780 [NASA ADS] [CrossRef] [Google Scholar]
- Battinelli, P., & Demers, S. 2005, A&A, 434, 657 [NASA ADS] [CrossRef] [EDP Sciences] [Google Scholar]
- Battinelli, P., & Demers, S. 2009, A&A, 493, 1075 [NASA ADS] [CrossRef] [EDP Sciences] [Google Scholar]
- Battinelli, P., Demers, S., & Artigau, É. 2007a, A&A, 466, 875 [NASA ADS] [CrossRef] [EDP Sciences] [Google Scholar]
- Battinelli, P., Demers, S., & Mannucci, F. 2007b, A&A, 474, 35 [NASA ADS] [CrossRef] [EDP Sciences] [Google Scholar]
- Bertin, E. 2006, Astronomical Data Analysis Software and Systems XV, 351, 112 [NASA ADS] [Google Scholar]
- Bertin, E., Mellier, Y., Radovich, M., et al. 2002, Astronomical Data Analysis Software and Systems XI, 281, 228 [NASA ADS] [Google Scholar]
- Bessell, M. S., & Wood, P. R. 1984, PASP, 96, 247 [NASA ADS] [CrossRef] [Google Scholar]
- Blanco, B. M., Blanco, V. M., & McCarthy, M. F. 1978, Nature, 271, 638 [NASA ADS] [CrossRef] [Google Scholar]
- Bressan, A., Marigo, P., Girardi, L., et al. 2012, MNRAS, 427, 127 [NASA ADS] [CrossRef] [Google Scholar]
- Cioni, M.-R. L. 2009, A&A, 506, 1137 [NASA ADS] [CrossRef] [EDP Sciences] [Google Scholar]
- Cioni, M.-R. L., & Habing, H. J. 2003, A&A, 402, 133 [NASA ADS] [CrossRef] [EDP Sciences] [Google Scholar]
- Cioni, M.-R. L., & Habing, H. J. 2005, A&A, 429, 837 [NASA ADS] [CrossRef] [EDP Sciences] [Google Scholar]
- Cioni, M.-R. L., van der Marel, R. P., Loup, C., & Habing, H. J. 2000, A&A, 359, 601 [NASA ADS] [Google Scholar]
- Cole, A. A., Tolstoy, E., Gallagher, J. S., III, et al. 1999, AJ, 118, 1657 [NASA ADS] [CrossRef] [Google Scholar]
- Costa, E., & Frogel, J. A. 1996, AJ, 112, 2607 [NASA ADS] [CrossRef] [Google Scholar]
- Crnojević, D., Rejkuba, M., Grebel, E. K., da Costa, G., & Jerjen, H. 2011, A&A, 530, A58 [NASA ADS] [CrossRef] [EDP Sciences] [Google Scholar]
- Cutri, R. M., Skrutskie, M. F., van Dyk, S., et al. 2003, VizieR On-line Data Catalog: II/246 [Google Scholar]
- Da Costa, G. S. 1998, Stellar astrophysics for the local group: VIII Canary Islands Winter School of Astrophysics (New-York: Cambridge University Press), 351 [Google Scholar]
- Davidge, T. J. 2005, AJ, 130, 2087 [NASA ADS] [CrossRef] [Google Scholar]
- Demers, S., Dallaire, M., & Battinelli, P. 2002, AJ, 123, 3428 [NASA ADS] [CrossRef] [Google Scholar]
- Dolphin, A. E., Saha, A., Skillman, E. D., et al. 2001, ApJ, 550, 554 [NASA ADS] [CrossRef] [Google Scholar]
- Feast, M. W., Abedigamba, O. P., & Whitelock, P. A. 2010, MNRAS, 408, L76 [NASA ADS] [Google Scholar]
- Freedman, W. L. 1988, ApJ, 326, 691 [NASA ADS] [CrossRef] [Google Scholar]
- Freedman, W. L. 1992, AJ, 104, 1349 [NASA ADS] [CrossRef] [Google Scholar]
- Girardi, L., Bertelli, G., Bressan, A., et al. 2002, A&A, 391, 195 [NASA ADS] [CrossRef] [EDP Sciences] [Google Scholar]
- Girardi, L., Groenewegen, M. A. T., Hatziminaoglou, E., & da Costa, L. 2005, A&A, 436, 895 [NASA ADS] [CrossRef] [EDP Sciences] [Google Scholar]
- Girardi, L., Williams, B. F., Gilbert, K. M., et al. 2010, ApJ, 724, 1030 [NASA ADS] [CrossRef] [Google Scholar]
- Grebel, E. K. 1999, in The Stellar Content of Local Group Galaxies, eds. P. Whitelock, & R. Cannon, IAU Symp., 192, 17 [Google Scholar]
- Groenewegen, M. A. T., Baas, F., Blommaert, J. A. D. L., et al. 1999, A&AS, 140, 197 [NASA ADS] [CrossRef] [EDP Sciences] [Google Scholar]
- Gullieuszik, M., Held, E. V., Rizzi, L., et al. 2008, MNRAS, 388, 1185 [NASA ADS] [CrossRef] [Google Scholar]
- Held, E. V., Gullieuszik, M., Rizzi, L., et al. 2010, MNRAS, 404, 1475 [NASA ADS] [Google Scholar]
- Hodge, P. 1989, ARA&A, 27, 139 [NASA ADS] [CrossRef] [Google Scholar]
- Iben, I., Jr., & Renzini, A. 1983, ARA&A, 21, 271 [NASA ADS] [CrossRef] [Google Scholar]
- Jackson, D. C., Skillman, E. D., Gehrz, R. D., Polomski, E., & Woodward, C. E. 2007, ApJ, 667, 891 [NASA ADS] [CrossRef] [Google Scholar]
- Jung, M. Y., Ko, J., Kim, J.-W., et al. 2012, A&A, 543, A35 [NASA ADS] [CrossRef] [EDP Sciences] [Google Scholar]
- Kalirai, J. S., Marigo, P., & Tremblay, P.-E. 2014, ApJ, 782, 17 [NASA ADS] [CrossRef] [Google Scholar]
- Kang, A., Sohn, Y.-J., Rhee, J., et al. 2005, A&A, 437, 61 [NASA ADS] [CrossRef] [EDP Sciences] [Google Scholar]
- Kang, A., Sohn, Y.-J., Kim, H.-I., et al. 2006, A&A, 454, 717 [NASA ADS] [CrossRef] [EDP Sciences] [Google Scholar]
- Kacharov, N., Rejkuba, M., & Cioni, M.-R. L. 2012, A&A, 537, A108 [NASA ADS] [CrossRef] [EDP Sciences] [Google Scholar]
- Karakas, A. I. 2003, Ph.D. Thesis, Monash University [Google Scholar]
- Lake, G., & Skillman, E. D. 1989, AJ, 98, 1274 [NASA ADS] [CrossRef] [Google Scholar]
- Lozinskaya, T. A., Moiseev, A. V., Afanas’Ev, V. L., Wilcots, E., & Goss, W. M. 2001, Astron. Rep., 45, 417 [NASA ADS] [CrossRef] [Google Scholar]
- Maraston, C. 2005, MNRAS, 362, 799 [NASA ADS] [CrossRef] [Google Scholar]
- Maraston, C., Daddi, E., Renzini, A., et al. 2006, ApJ, 652, 85 [NASA ADS] [CrossRef] [Google Scholar]
- Marigo, P., Girardi, L., & Chiosi, C. 2003, A&A, 403, 225 [NASA ADS] [CrossRef] [EDP Sciences] [Google Scholar]
- Mateo, M. L. 1998, ARA&A, 36, 435 [NASA ADS] [CrossRef] [Google Scholar]
- Mouhcine, M., & Lançon, A. 2003, MNRAS, 338, 572 [NASA ADS] [CrossRef] [Google Scholar]
- Mould, J., & Aaronson, M. 1982, ApJ, 263, 629 [NASA ADS] [CrossRef] [Google Scholar]
- Nowotny, W., Kerschbaum, F., Olofsson, H., & Schwarz, H. E. 2003, A&A, 403, 93 [NASA ADS] [CrossRef] [EDP Sciences] [MathSciNet] [Google Scholar]
- Pietrzyński, G., Gieren, W., Soszyński, I., et al. 2006, ApJ, 642, 216 [NASA ADS] [CrossRef] [Google Scholar]
- Rejkuba, M., da Costa, G. S., Jerjen, H., Zoccali, M., & Binggeli, B. 2006, A&A, 448, 983 [NASA ADS] [CrossRef] [EDP Sciences] [Google Scholar]
- Richer, M. G., & McCall, M. L. 1995, ApJ, 445, 642 [NASA ADS] [CrossRef] [Google Scholar]
- Saha, A., Freedman, W. L., Hoessel, J. G., & Mossman, A. E. 1992, AJ, 104, 1072 [NASA ADS] [CrossRef] [Google Scholar]
- Sandage, A. 1971, ApJ, 166, 13 [NASA ADS] [CrossRef] [Google Scholar]
- Scalo, J. M., & Miller, G. E. 1981, ApJ, 248, L65 [NASA ADS] [CrossRef] [Google Scholar]
- Schlegel, D. J., Finkbeiner, D. P., & Davis, M. 1998, ApJ, 500, 525 [NASA ADS] [CrossRef] [Google Scholar]
- Sibbons, L. F., Ryan, S. G., Cioni, M.-R. L., Irwin, M., & Napiwotzki, R. 2012, A&A, 540, A135 [NASA ADS] [CrossRef] [EDP Sciences] [Google Scholar]
- Sibbons, L. F., Ryan, S. G., Irwin, M., & Napiwotzki, R. 2015, A&A, 573, A84 [NASA ADS] [CrossRef] [EDP Sciences] [Google Scholar]
- Skillman, E. D., Tolstoy, E., Cole, A. A., et al. 2003, ApJ, 596, 253 [NASA ADS] [CrossRef] [Google Scholar]
- Skillman, E. D., Hidalgo, S. L., Weisz, D. R., et al. 2014, ApJ, 786, 44 [NASA ADS] [CrossRef] [Google Scholar]
- Sohn, Y.-J., Kang, A., Rhee, J., et al. 2006, A&A, 445, 69 [NASA ADS] [CrossRef] [EDP Sciences] [Google Scholar]
- Stetson, P. B. 1987, PASP, 99, 191 [NASA ADS] [CrossRef] [Google Scholar]
- Stetson, P. B., & Harris, W. E. 1988, AJ, 96, 909 [NASA ADS] [CrossRef] [Google Scholar]
- Tikhonov, N. A., & Galazutdinova, O. A. 2002, A&A, 394, 33 [NASA ADS] [CrossRef] [EDP Sciences] [Google Scholar]
- Tolstoy, E. 1999, The Stellar Content of Local Group Galaxies, Proc. of the 192nd IAU, ASP, 192, 218 [Google Scholar]
- Valenti, E., Ferraro, F. R., & Origlia, L. 2004, MNRAS, 354, 815 [NASA ADS] [CrossRef] [Google Scholar]
- Zucker, D. B., & Wyder, T. K. 2004, in Origin and Evolution of the Elements, a Carnegie Observatories Astrophysics Series, 4, eds. A. McWilliam, & M. Rauch (Cambridge: Cambridge University Press) [Google Scholar]
All Tables
Sky position, magnitudes, and photometric errors in J, H, and Ks band for the identified AGB stars in IC 1613.
All Figures
|
Fig. 1 Results of artificial star experiments on the JHKs images; the completeness ratio defined as the recovery rate of the input artificial stars (top), the rms difference magnitude (△ M) between the input magnitudes and the measured magnitudes (middle), the standard deviation of the △ M (bottom). Solid, dotted, and dashed lines indicate the J,H, and Ks bands. |
| In the text | |
|
Fig. 2 (J − Ks,Ks) and (H − Ks,Ks) CMDs for the resolved stars detected in near-infrared observation (upper) and for the commonly detected stars in the near-infrared and optical data of Battinelli et al. (2007a) (lower). The magnitude and color range of TRGB (Valenti et al. 2004) for the given metallicity of [Fe/H] = −1.75 ~ − 1.3 is indicated by the solid line. The estimated magnitude in Ks of TRGB in this study is indicated by an arrow at Ks = 18.2. The open circles are 82 C stars cross-identified in both the giJHKs photometry (this study) and CNTiO photometry of Albert et al. (2000). |
| In the text | |
|
Fig. 3 Lower panel: luminosity function in Ks for the stars in the giJHKs photometry of IC 1613. The black solid line is the number of stars in the 0.065 mag bin, and the gray solid line is the completeness-corrected number of stars. Upper panel: the second derivatives of the observed and the completeness-corrected LF. The vertical dotted line at Ks = 18.2 indicates the detected magnitude of the TRGB discontinuity and its peak. |
| In the text | |
|
Fig. 4 CMDs with the color indices of gi minus JHKs band and gi magnitudes. The colored dots are the stars that are brighter than the TRGB magnitude (Ks = 18.2), which corresponds to the slanted line in the (g − Ks,g) CMD. The Galactic foreground and supergiants stars are indicated by the blue and orange dots, respectively. The green and red dots correspond to the M-giant and C stars. The red curves in the (g − Ks,g) CMD are isochrones (Girardi et al. 2010) for the metallicity of Z = 0.001 with an age of log (tyr) = 9.0,9.4. |
| In the text | |
|
Fig. 5 (J − Ks,Ks) CMD of stars brighter than Ks = 18.2 with the theoretical isochrones of log (tyr) = 8.6,9.0, and 9.4 with Z = 0.001 (upper panel) and log (tyr) = 8.6,9.0, and 10.0 with Z = 0.008 (lower panel). The notations of the observed stellar population are the same as those in Fig. 4. The isochrones of Girardi et al. (2010) (solid line) and Bressan et al. (2012) (dotted line) are used to compare the stellar populations in IC 1613. The black lines correspond to the pre-TP-AGB stars, and the blue and red lines represent M-giants and C stars, respectively. |
| In the text | |
|
Fig. 6 (H − Ks) − (J − Ks) CCD for the selected AGB stars and the color distributions of (H − Ks) (upper panel) and (J − Ks) (right panel). The dotted lines indicate the separation color limit between the M-giants and C stars. The green and red dots are the identified M-giants and C stars. The open circles indicate 82 C stars cross-identified in both the giJHKs photometry (this study) and CNTiO photometry of Albert et al. (2000). |
| In the text | |
|
Fig. 7 (J − Ks) and (H − Ks) color distribution for the selected 446 AGB stars (upper panel) and 306 M-giant stars (bottom panel) in IC 1613. The peak of the color histogram for the AGB stars is described by a Gaussian function with standard deviation (σ). Black arrows indicate the theoretical (J − Ks) colors at MKs = −7.0 in the Girardi et al. (2010) isochrones with Z = 0.008 and ages of log (tyr) = 8.6,9.0, and 10.0, while red arrows show the (J − Ks) colors of isochrones with Z = 0.001 and ages of log (tyr) = 8.6,9.0, and 9.4. |
| In the text | |
|
Fig. 8 Left panel: completeness-corrected LFs in the MKs for the C stars (upper) and M-giant stars (lower) in IC 1613. The smaller box in the lower panel shows the logarithmic LF of the M-giant stars. Right panel: completeness-corrected bolometric LFs for the C stars (upper panel) and M-giant stars (lower panel). The luminosities of the AGB tip with ages of 3,5,8, and 10 Gyr obtained from the Mbol-age relation of Rejkuba et al. (2006) are indicated as thick lines. |
| In the text | |
|
Fig. 9 Distributions of C stars (filled dot) and M-giant stars (open triangle) over the VLA HI map of Lozinskaya et al. (2001). The five circles with 2 arcmin in radius were arbitrarily selected to investigate the local C/M ratio variations. |
| In the text | |
|
Fig. 10 Radial distribution of the C/M ratio from the center of the HI cavity and the inferred [Fe/H] of IC 1613 according to the relation between the C/M ratio and metallicity by Cioni (2009). |
| In the text | |
|
Fig. 11 Cumulative radial distributions of C stars (dotted line) and M-giant stars (solid line) of IC 1613 from the center of the HI cavity. We also plot the cumulative radial distribution of red supergiant stars (dashed line) that were misidentified as M-giant stars in re-identified AGB stars. The K-S test probability is also indicated. |
| In the text | |
Current usage metrics show cumulative count of Article Views (full-text article views including HTML views, PDF and ePub downloads, according to the available data) and Abstracts Views on Vision4Press platform.
Data correspond to usage on the plateform after 2015. The current usage metrics is available 48-96 hours after online publication and is updated daily on week days.
Initial download of the metrics may take a while.