Fig. 6
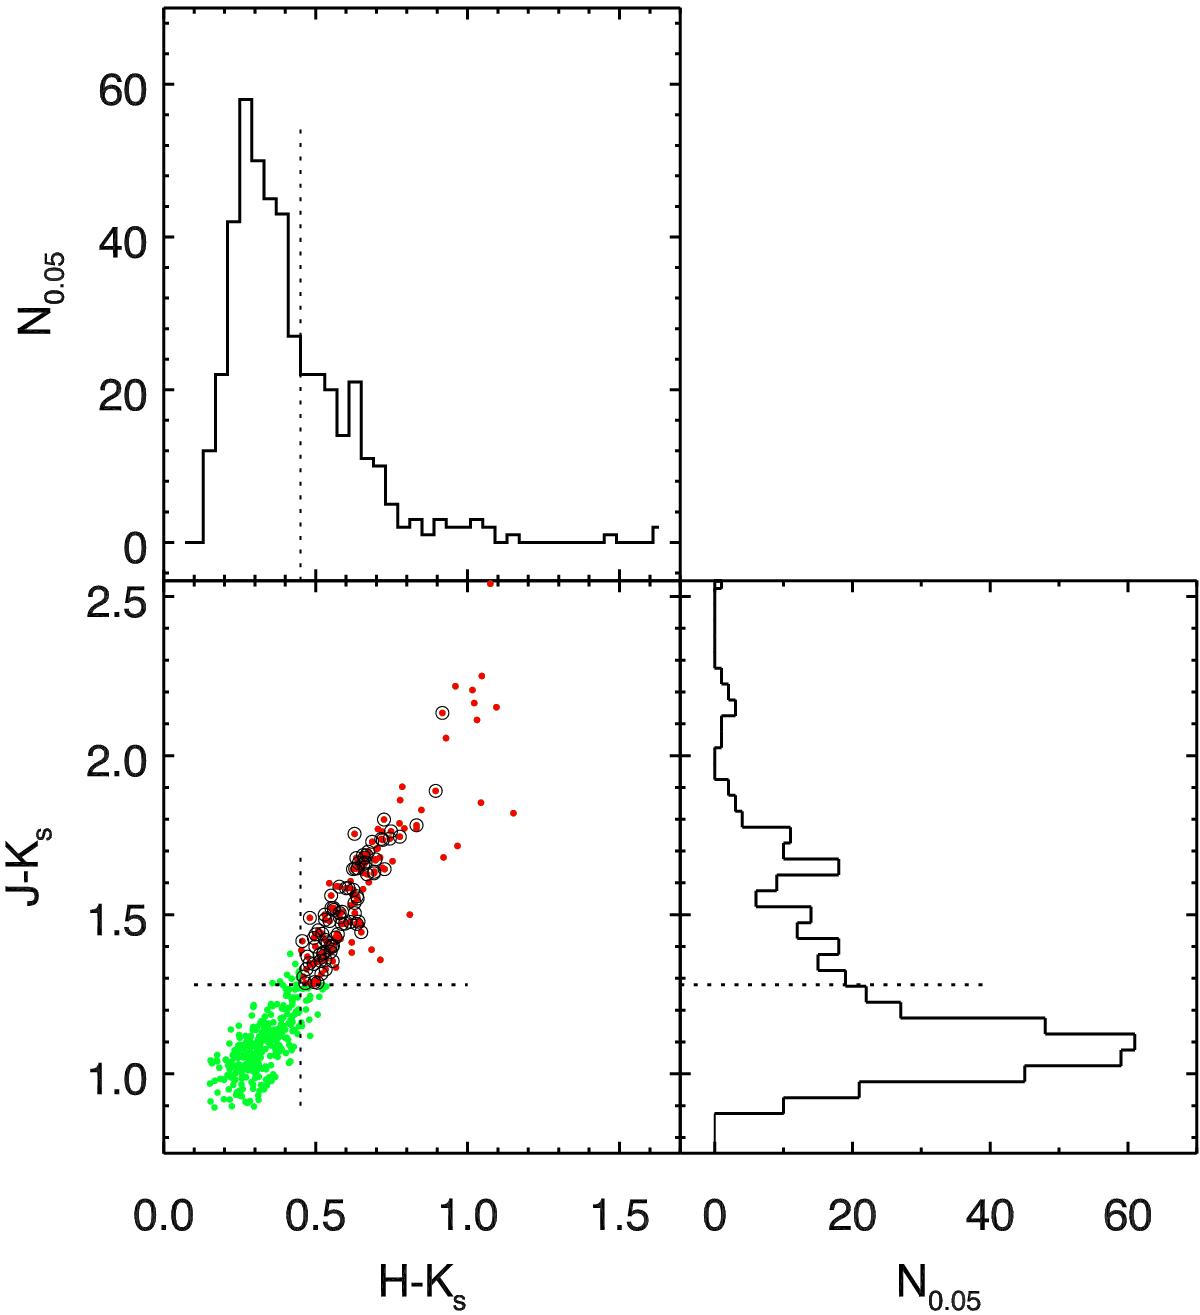
(H − Ks) − (J − Ks) CCD for the selected AGB stars and the color distributions of (H − Ks) (upper panel) and (J − Ks) (right panel). The dotted lines indicate the separation color limit between the M-giants and C stars. The green and red dots are the identified M-giants and C stars. The open circles indicate 82 C stars cross-identified in both the giJHKs photometry (this study) and CNTiO photometry of Albert et al. (2000).
Current usage metrics show cumulative count of Article Views (full-text article views including HTML views, PDF and ePub downloads, according to the available data) and Abstracts Views on Vision4Press platform.
Data correspond to usage on the plateform after 2015. The current usage metrics is available 48-96 hours after online publication and is updated daily on week days.
Initial download of the metrics may take a while.