Fig. 11
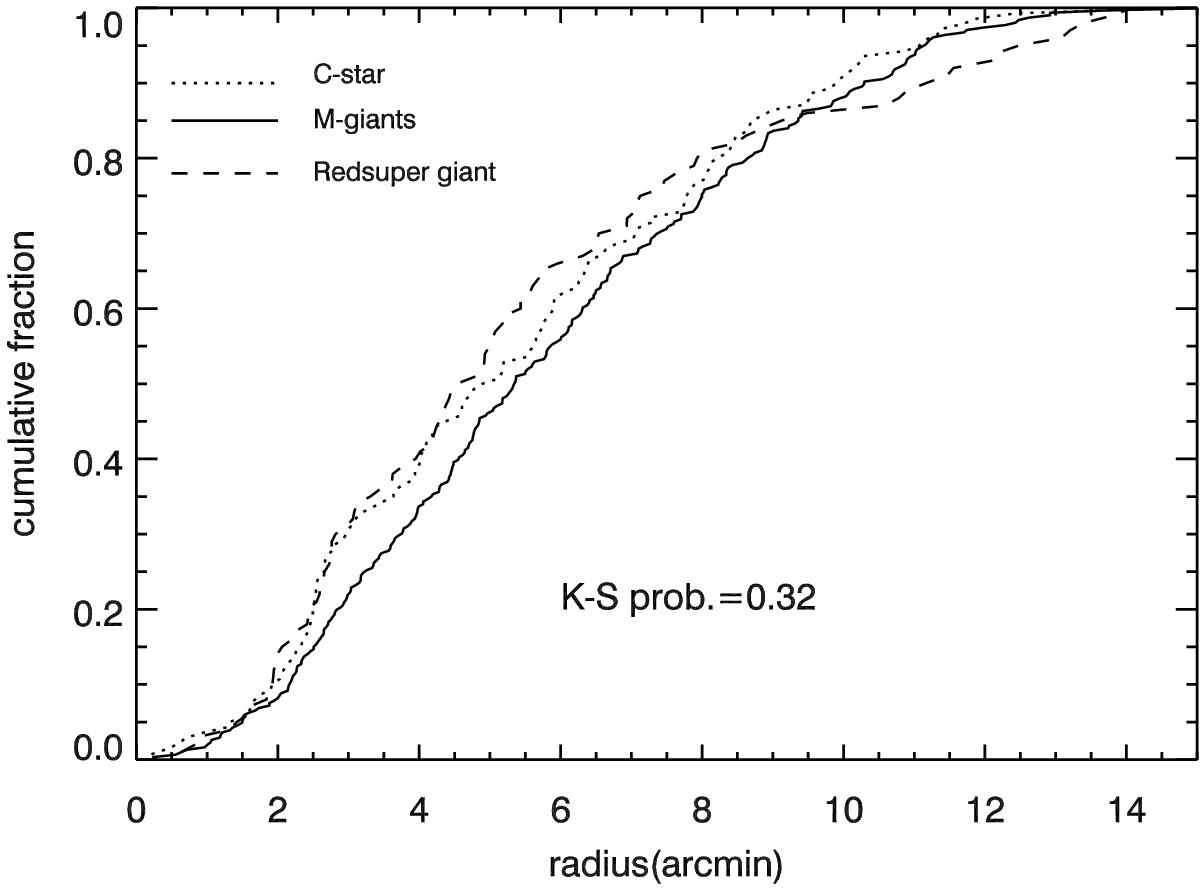
Cumulative radial distributions of C stars (dotted line) and M-giant stars (solid line) of IC 1613 from the center of the HI cavity. We also plot the cumulative radial distribution of red supergiant stars (dashed line) that were misidentified as M-giant stars in re-identified AGB stars. The K-S test probability is also indicated.
Current usage metrics show cumulative count of Article Views (full-text article views including HTML views, PDF and ePub downloads, according to the available data) and Abstracts Views on Vision4Press platform.
Data correspond to usage on the plateform after 2015. The current usage metrics is available 48-96 hours after online publication and is updated daily on week days.
Initial download of the metrics may take a while.