| Issue |
A&A
Volume 577, May 2015
|
|
|---|---|---|
| Article Number | A80 | |
| Number of page(s) | 5 | |
| Section | Extragalactic astronomy | |
| DOI | https://doi.org/10.1051/0004-6361/201525644 | |
| Published online | 06 May 2015 | |
Dust production 680–850 million years after the Big Bang
SUPA, Institute for Astronomy, University of Edinburgh, Royal
Observatory, Blackford
Hill, Edinburgh
EH9 3HJ, UK
⋆
e-mail: mm@roe.ac.uk
Received: 12 January 2015
Accepted: 23 March 2015
Dust plays an important role in our understanding of the Universe, but it is not obvious yet how the dust in the distant universe was formed. I derived the dust yields per asymptotic giant branch (AGB) star and per supernova (SN) required to explain dust masses of galaxies at z = 6.3–7.5 (680–850 million years after the Big Bang) for which dust emission has been detected (HFLS3 at z = 6.34, ULAS J1120+0641 at z = 7.085, and A1689-zD1 at z = 7.5), or unsuccessfully searched for. I found very high required yields, implying that AGB stars could not contribute substantially to dust production at these redshifts, and that SNe could explain these dust masses, but only if they do not destroy most of the dust they form (which is unlikely given the upper limits on the SN dust yields derived for galaxies where dust is not detected). This suggests that the grain growth in the interstellar medium is likely required at these early epochs.
Key words: stars: AGB and post-AGB / supernovae: general / dust, extinction / galaxies: high-redshift / galaxies: ISM / quasars: general
© ESO, 2015
1. Introduction
Dust plays an important role in our understanding of the Universe, both hiding the regions of intense star formation and allowing this information to be regained by the observations of its thermal emission. It is, however, not obvious yet how the dust in the distant universe was formed, as dust formation requires specific conditions of relatively low temperature and high density. These conditions are met in atmospheres of asymptotic giant branch (AGB) stars and expelled shells of supernova (SN) remnants (see Gall et al. 2011c, for a review). Another possibility is that these stellar sources produce only dust seeds, and most dust mass accumulation happens in the interstellar medium (ISM; Draine & Salpeter 1979).
Dust has been observed to form in numerous AGB stars (Meixner et al. 2006; Matsuura et al. 2009, 2013; Sloan et al. 2009; Srinivasan et al. 2009; Boyer et al. 2011, 2012; Riebel et al. 2012), and it was shown theoretically that one AGB star can produce up to ~0.04 M⊙ of dust (Morgan & Edmunds 2003; Ferrarotti & Gail 2006; Ventura et al. 2012; Nanni et al. 2013, 2014; Schneider et al. 2014). This maximum dust mass is returned only for a narrow range of the mass of an AGB star progenitor (~4 M⊙) and for super-solar metallicity (Table 3 in Ferrarotti & Gail 2006). For solar and subsolar metallicities, up to ~0.02 M⊙ of dust can be produced by an AGB star, with a typical value of ~0.001 M⊙ across a wider mass range. It has been claimed that AGB stars produce most of the stellar dust (as opposed to dust grown in the ISM) in the Milky Way and local galaxies (Gehrz 1989; Zhukovska & Henning 2013), but also in high-redshift quasars (Valiante et al. 2009, 2011).
Theoretical models predict that a SN can produce at most ~1.3 M⊙ of dust (Todini & Ferrara 2001; Nozawa et al. 2003), but likely only ≲0.1 M⊙ survives the associated shocks and is released into the ISM (Bianchi & Schneider 2007; Cherchneff & Dwek 2010; Gall et al. 2011a; Lakićević et al. 2015). Large amounts of dust have been found in the remnants of Cassiopeia A (Dunne et al. 2003, 2009) and Kepler (Morgan et al. 2003; Gomez et al. 2009) (~1 M⊙); SN 1987A (~0.4–0.7 M⊙; Matsuura et al. 2011; Indebetouw et al. 2014), and the Crab Nebula (~0.02–0.2 M⊙Gomez et al. 2012; Temim & Dwek 2013). However, the high dust yields for Cassiopeia A and Kepler are still controversial (Dwek 2004; Krause et al. 2004; Gomez et al. 2005; Wilson & Batrla 2005; Blair et al. 2007; Sibthorpe et al. 2010; Barlow et al. 2010), and dust masses for other SN remnants are typically much lower, of the order of 10-3–10-2M⊙ (Green et al. 2004; Borkowski et al. 2006; Sugerman et al. 2006; Ercolano et al. 2007; Meikle et al. 2007; Rho et al. 2008, 2009; Kotak et al. 2009; Lee et al. 2009; Sakon et al. 2009; Sandstrom et al. 2009; Wesson et al. 2009; Gallagher et al. 2012; Temim et al. 2012). Some of this discrepancy can be attributed to different observed wavelengths used by different authors. If the dust is relatively cold, then mid-infrared Spitzer observations do not probe the dominant cold dust component, and would underestimate the total dust mass. Moreover, this difference may be connected with the evolutionary stage of a SN remnant. Recently, Gall et al. (2014) found very large grains in the circumstellar medium of a SN just a few months after the explosion, and claimed that such grains are able to survive the shocks and help to condense larger amounts of dust a few tens of years later.
It has been claimed that SNe are the main dust producers at high redshifts, when at least some of the intermediate-mass stars had not had enough time to reach the AGB phase (Dwek et al. 2007, 2011, 2014; Dwek & Cherchneff 2011; Michałowski et al. 2010c,b; Gall et al. 2011b; Hjorth et al. 2014; Rowlands et al. 2014). However, using the ALMA non-detection of a z ~ 6.6 Lyα emitter (Ouchi et al. 2013), Hirashita et al. (2014) found that only <0.15–0.45 M⊙ of dust can be returned to the ISM by a SN.
Because of this difficulty in finding an efficient dust production mechanism by stellar sources, the grain growth in the ISM has been claimed to be necessary for the Milky Way (Draine & Salpeter 1979; Dwek & Scalo 1980; Draine 1990, 2009), local galaxies (Matsuura et al. 2009; Grootes et al. 2013), and distant galaxies (Dwek et al. 2007; Michałowski et al. 2010c,b; Hirashita & Kuo 2011; Mattsson 2011; Mattsson & Andersen 2012; Kuo & Hirashita 2012; Asano et al. 2013; Calura et al. 2014; Hjorth et al. 2014; Rowlands et al. 2014; Valiante et al. 2014; Nozawa et al. 2015). The grain growth timescale is relatively short (a few tens of Myr; Draine 1990, 2009; Hirashita 2000, 2012; Zhukovska et al. 2008), which is consistent with very little variation in the metal-to-dust ratios in gamma-ray burst (GRB) and quasar absorbers, as this implies very rapid dust production soon after metal enrichment (Zafar & Watson 2013). However, metal-to-dust ratios are higher at metallicities well below 0.1 solar, as shown by IZw18 (Fig. 2 in Zafar & Watson 2013) and by a steeper slope of the gas-to-dust ratio for low metallicities (Fig. 4 in Rémy-Ruyer et al. 2014). This is connected with the grain growth timescale being much longer in the metal-poor environments (Eq. (20) of Asano et al. 2013) when stellar sources are the main dust producers.
Apart from using the total dust budget arguments, these three possibilities are very difficult to distinguish because doing so would require precise measurements of dust properties (grain size distribution and chemical composition). Therefore, SN-origin dust has only been claimed based on extinction curves of a z ~ 6.2 quasar (Maiolino et al. 2004; Gallerani et al. 2010; but see Hjorth et al. 2013) and two GRB host galaxies at z ~ 6.3 (Stratta et al. 2007; but see Zafar et al. 2010, 2011) and z ~ 5 (Perley et al. 2010).
The objective of this paper is to investigate whether SNe and AGB stars are efficient enough to form dust at 6.3 <z< 7.5 (680–850 million years after the Big Bang), or if grain growth in the ISM is required. I use a cosmological model with H0 = 70 km s-1 Mpc-1, ΩΛ = 0.7, and Ωm = 0.3.
2. Sample
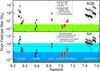 |
Fig. 1 Dust yield per AGB star (top) and per SN (bottom) required to explain dust masses measured in z> 6.3 galaxies for all possible combinations of dust and stellar masses (Table 1; the points were shifted slightly in redshift for clarity). Symbols are colour-coded according to the way the stellar mass was estimated: from SED modelling (black), assuming that the stellar mass is the difference between the dynamical and gas masses (yellow), or that it is equal to the dynamical mass (red). Filled circles, crosses, and open circles denote the assumption of the Chabrier, Salpeter (α = 2.35), and top-heavy (α = 1.5) IMFs, respectively. Small symbols with arrows correspond to galaxies with only upper limits for dust masses (lower part of Table 1). |
For this study I selected all galaxies at z> 6.3 for which dust emission has been detected (with the exception of SDSS J1148+5251, a z = 6.42 quasar that was a subject of the study in Michałowski et al. 2010b, and MACS1149-JD, a z ~ 9.6 Lyman break galaxy (LBG), because its association with the 2 mm GISMO object has not yet been confirmed; Dwek et al. 2014). The sample includes HFLS3, a red Herschel-selected z = 6.34 galaxy (Riechers et al. 2013); ULAS J1120+0641, a colour-selected z = 7.085 quasar (Mortlock et al. 2011; Venemans et al. 2012); and A1689-zD1, a lensed z = 7.5 Lyman break galaxy (Watson et al. 2015).
Additionally, I selected galaxies at z> 6.3 for which the dust emission has been unsuccessfully searched for: z = 6.56 lensed Lyα emitter HCM6A (Hu et al. 2002; Kanekar et al. 2013, magnification factor of 4.5), z = 6.8 lensed LBG A1703-zD1 (Bradley et al. 2012; Schaerer et al. 2015, magnification factor of 9), z = 6.595 Lyα emitter Himiko (Ouchi et al. 2009, 2013), z = 6.96 Lyα emitter IOK-1 (Iye et al. 2006; Ota et al. 2014), and z = 7.508 LBG z8-GND-5296 (Finkelstein et al. 2013; Schaerer et al. 2015).
Table 1 presents the relevant properties of these galaxies, which are adopted from the references listed in the last column, except for the third stellar mass estimate for HFLS3 and the gas mass estimate for ULASJ1120+0641. Dust masses from Schaerer et al. (2015) are adopted with the Tdust = 35 K option. Multiple values for a given property denote different assumptions adopted when deriving it (temperatures and emissivity index for dust masses, and star formation histories for stellar masses). I converted all dust mass estimates to a common mass absorption coefficient of κ1200 μm = 0.67 cm2g-1, and stellar masses to the Chabrier initial mass function (IMF).
Properties of the galaxies in my sample.
For the stellar mass estimation for HFLS3 I used the photometry presented in Riechers et al. (2013) and applied the spectral energy distribution (SED) fitting method detailed in Michałowski et al. (2008, 2009, 2010a,c, see therein the discussion of the derivation of galaxy properties and typical uncertainties), which is based on 35 000 templates from the library of Iglesias-Páramo et al. (2007) and some templates from Silva et al. (1998) and Michałowski et al. (2008), all of which were developed using Grasil1 (Silva et al. 1998). They are based on numerical calculations of radiative transfer within a galaxy, which is assumed to be a triaxial axisymmetric system with diffuse dust and dense molecular clouds, in which stars are born.
I estimated the gas mass of ULASJ1120+0641 from the [C ii] luminosity, LCII (Venemans et al. 2012), using the empirical calibration of Swinbank et al. (2012): Mgas = (10 ± 2)(LCII/L⊙). The uncertainty of this estimate has little effect on my result, as this mass corresponds only to ~10% of the dynamical mass estimate.
3. Method
The redshifts of the galaxies considered here correspond to at most ~500 Myr of evolution, depending on the formation redshift. Hence, for AGB stars I only considered stars more massive than 3 M⊙, as less-massive stars have not had time to leave the main sequence and to produce dust (the main-sequence lifetime is 1010 yr × [ M/M⊙ ] -2.5; e.g., Kippenhahn & Weigert 1990).
I calculated the dust yields per AGB star and per SN (amount of dust formed in ejecta of
one star) required to explain the inferred dust masses in these galaxies as described in
Michałowski et al. (2010c,b). Namely, the number of stars with masses between M0 and
M1
in the stellar population with a total stellar mass of Mstar was
calculated as N(M0–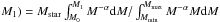 , where (M0,M1)
= (3,8) M⊙ for AGB stars and (8,40) M⊙ for SNe,
respectively. Depending on the galaxy, Mstar was estimated in three ways: derived
from the SED modelling (reported in Cols. 6–8 of Table 1), assumed to be equal to Mdyn − Mgas
and equal to Mdyn. The average dust yield per star is
Mdust/N(M0–M1). With these
assumptions this yield is f ×
(Mdust/Mstar),
where
, where (M0,M1)
= (3,8) M⊙ for AGB stars and (8,40) M⊙ for SNe,
respectively. Depending on the galaxy, Mstar was estimated in three ways: derived
from the SED modelling (reported in Cols. 6–8 of Table 1), assumed to be equal to Mdyn − Mgas
and equal to Mdyn. The average dust yield per star is
Mdust/N(M0–M1). With these
assumptions this yield is f ×
(Mdust/Mstar),
where 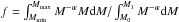 (Table 2).
I adopted an IMF with Mmin = 0.15, Mmax = 120 M⊙, and three possible shapes: Chabrier (2003), Salpeter (1955) with a slope α = 2.35, and top heavy with a slope α = 1.5.
4. Results
Figure 1 presents the dust yields per AGB star and per SN required to explain the observed dust masses using all possible combinations of stellar and dust masses presented in Table 1 and three choices of IMFs.
Initial mass functions assumed.
The maximum theoretical yield for an AGB star is shown as 0.04 M⊙ because, as explained above, it is a strict upper limit. For SNe I plot the theoretical value of a dust yield with no dust destruction (1.3 M⊙), and the expected dust mass returned to the ISM if dust destruction is taken into account (0.1 M⊙).
Among the three galaxies with dust detections Fig. 1 shows that only the dust mass of ULAS J1120+0641 can be explained by both AGB stars (required yields 0.015–0.04 M⊙ for the low dust mass options), or SNe with dust destruction taken into account (required yields 0.03–0.1 M⊙), and only if the real dust yields per star are close to the maximum theoretically allowed values. However, AGB stars are not able to produce dust in two other galaxies (required yields 0.1–1 M⊙), and SNe would need to return most of the formed dust without destroying it (required yields 0.2–1 M⊙).
Most of the galaxies not detected at the dust continuum (lower part of Table 1) have stellar masses that are too small to provide meaningful constraints on AGB and SN dust yields, in the sense that the dust mass expected from the resulting number of these stars is much lower than the measured dust mass upper limits. In Fig. 1, I show only the upper limits for Himiko and IOK-1, which are massive enough, so that the expected number of AGB stars and SNe is high enough to give reasonable constraints on the maximum dust yield per star. I found comparable results for Himiko with Hirashita et al. (2014); in this galaxy each SN could have produced only <0.2 M⊙ of dust assuming the top-heavy IMF, and <0.03–0.09 M⊙ for the Chabrier and Salpeter IMFs. In IOK-1, one SN could have produced <1.1 M⊙ of dust with the top-heavy IMF, and <0.5 M⊙ with the Chabrier and Salpeter IMFs. The dust yield upper limits for AGB stars are not constraining (above the theoretical limits), except for Himiko with the Chabrier and Salpeter IMFs, for which I derived <0.01–0.03 M⊙ of dust per AGB star.
Table 2 presents the factor f by which the Mdust/Mstar ratio needs to be multiplied for a given IMF to obtain the dust yield per star, and the factor by which the SED-derived stellar masses were multiplied for this IMF (the stellar mass factor for the top-heavy IMF with α = 1.5 is from Sternberg 1998). These factors can be quickly used to calculate the average dust yields, and they only depend on the adopted IMF and stellar mass ranges of dust producers.
5. Discussion
The dust yields per star shown in Fig. 1 imply that dust at z ~ 6.3–7.5 could not have been entirely formed by AGB stars, and that SNe are efficient enough only if they do not destroy the pre-existing dust and most of the dust they produce. However, such high SN dust yields are difficult to reconcile with upper limits derived for galaxies not detected at the dust continuum (Himiko and IOK-1, see Fig. 1 and Hirashita et al. 2014). This suggests that most of the dust mass in these galaxies had been formed in the ISM. This is in line with similar claims for galaxies at lower redshifts. If the grain growth in the ISM is as fast as ~10 Myr, then even at these redshifts there is a sufficient amount of time for such dust mass accumulation (metallicities of the galaxies considered here are likely to be above the critical value of ~0.1–0.3 solar, the point at which the contribution of the grain growth falls below that of stellar sources because of the long timescale of this growth; Asano et al. 2013; Rémy-Ruyer et al. 2014).
These conclusions obviously depend on how accurately the relevant masses were measured. I show here that they are robust because all my critical assumptions are conservative in the sense that they tend to bias the resulting required dust yield per star towards low values: i) I assumed a relatively high value of the mass absorption coefficient κ (compare with Alton et al. 2004), higher than what is usually assumed for distant galaxies, resulting in a systematically low Mdust; ii) I included the stellar mass alternatives, which represent virtually the maximum value, and I assumed that the entire dynamical mass is composed of stars (red symbols in Fig. 1) and assumed a double-component star formation history (SFH) in the SED modelling, which has been shown to result in higher stellar masses than single component SFHs (Michałowski et al. 2012, 2014); iii) by including all stars more massive than 3 M⊙ (with the main-sequence lifetime of ≲650 Myr), I implicitly assumed that the entire stellar mass was formed at the very beginning of the galaxy evolution, because otherwise a fraction of stars formed later had not finished their main-sequence stage and so should not be taken into account (the final dust mass depends on the SFHs, not only on the final stellar mass). This extreme SFH is not ruled out by the data, but is highly unlikely; iv) the theoretically allowed (coloured) regions in Fig. 1 represent the maximum dust yield per star, which does not apply to all stars in a given mass range, so the average dust yield per star is lower; and v) I implicitly assumed that dust injected into the ISM is not subsequently destroyed by astration, interstellar shocks, or outflows, otherwise the produced dust masses would be higher than the currently existing dust masses and, in turn, the required stellar dust yields would be higher. In each of these cases different (more realistic) assumptions than those chosen here would result in even higher required dust yields, making my conclusions even stronger.
Moreover, in this analysis I considered AGB stars and SNe separately as dust producers. In reality, both sources operate simultaneously, at least when AGB star progenitors evolve off the main sequence. If the contribution of AGB stars and SNe is equal, then this would bring the points in Fig. 1 down by a factor of two, which would not change my conclusions.
The choice of the IMF does not influence these conclusions strongly. For the same dust and stellar masses the Salpeter IMF results in yields that are a factor of ~1.5 higher than for the Chabrier IMF (see factor f in Table 2), which makes it even more difficult to explain the observed dust masses. Since the SED-derived stellar masses are a factor of ~1.8 higher for the Salpeter IMF, the resulting yields using these SED-derived masses are almost identical to those derived with the Chabrier IMF.
Adopting the top-heavy IMF (and keeping masses the same) would increase the required dust yield per AGB star by a factor of ~1.6 (fAGB in Table 2), virtually ruling out their contribution to the dust production in these galaxies. On the other hand, in the top-heavy IMF the fraction of the most massive stars is higher, so the required dust yields per SN are lower by a factor of ~0.65 (fSN in Table 2). However, the SED-derived stellar masses are 3 times lower, so all in all the number of these massive stars is lower than in the Chabrier IMF, so the required dust yields are higher. Hence, the Chabrier IMF is the most conservative assumption (resulting in the lowest required yields).
Finally, it needs to be pointed out that the three galaxies with detected dust emission are very different to each other, as the sample includes a dusty starburst, a quasar, and a more typical star-forming galaxy (the galaxies with dust non-detections also fall into this last category). This means that their dust properties and origins may be vastly different, even at similar stellar masses. Hence, the relative contribution of AGB stars, SNe, and the ISM grain growth may be different in these sources.
6. Conclusions
Using all three galaxies at z = 6.3–7.5 (680–850 million years after the Big Bang) for which dust emission has been detected (HFLS3 at z = 6.34, ULAS J1120+0641 at z = 7.085, and A1689-zD1 at z = 7.5) and galaxies at the same redshift interval for which dust emission has not been detected, I found that AGB stars could not contribute substantially to the dust production at these redshifts, and that SNe could explain their dust masses, but only if they do not destroy most of the dust they form. This last constraint is unlikely given the upper limits on the SN dust yields derived for galaxies where dust has not been detected. This suggests that grain growth in the interstellar medium is likely to be required at these early epochs of the evolution of the Universe.
Acknowledgments
I thank Joanna Baradziej, Jens Hjorth, Darach Watson, and my anonymous referee for useful suggestions, and acknowledge the support of the UK Science and Technology Facilities Council. This research has made use of the NASA’s Astrophysics Data System Bibliographic Services; and the Edward Wright Cosmology Calculator www.astro.ucla.edu/~wright/CosmoCalc.html (Wright 2006).
References
- Alton, P. B., Xilouris, E. M., Misiriotis, A., Dasyra, K. M., & Dumke, M. 2004, A&A, 425, 109 [NASA ADS] [CrossRef] [EDP Sciences] [Google Scholar]
- Asano, R. S., Takeuchi, T. T., Hirashita, H., & Inoue, A. K. 2013, EP&S, 65, 213 [NASA ADS] [Google Scholar]
- Barlow, M. J., Krause, O., Swinyard, B. M., et al. 2010, A&A, 518, L138 [NASA ADS] [CrossRef] [EDP Sciences] [Google Scholar]
- Bianchi, S., & Schneider, R. 2007, MNRAS, 378, 973 [NASA ADS] [CrossRef] [Google Scholar]
- Blair, W. P., Ghavamian, P., Long, K. S., et al. 2007, ApJ, 662, 998 [NASA ADS] [CrossRef] [Google Scholar]
- Borkowski, K., Williams, B., Reynolds, S., et al. 2006, ApJ, 642, L141 [NASA ADS] [CrossRef] [Google Scholar]
- Boyer, M. L., Srinivasan, S., van Loon, J. T., et al. 2011, AJ, 142, 103 [Google Scholar]
- Boyer, M. L., Srinivasan, S., Riebel, D., et al. 2012, ApJ, 748, 40 [NASA ADS] [CrossRef] [Google Scholar]
- Bradley, L. D., Bouwens, R. J., Zitrin, A., et al. 2012, ApJ, 747, 3 [NASA ADS] [CrossRef] [Google Scholar]
- Calura, F., Gilli, R., Vignali, C., et al. 2014, MNRAS, 438, 2765 [NASA ADS] [CrossRef] [Google Scholar]
- Chabrier, G. 2003, ApJ, 586, L133 [NASA ADS] [CrossRef] [Google Scholar]
- Cherchneff, I., & Dwek, E. 2010, ApJ, 713, 1 [NASA ADS] [CrossRef] [Google Scholar]
- Draine, B. T. 1990, in The Evolution of the Interstellar Medium, ed. L. Blitz, ASP Conf. Ser., 12, 193 [Google Scholar]
- Draine, B. T. 2009, in ASP Conf. Ser. 414, eds. T. Henning, E. Grün, & J. Steinacker, 453 [Google Scholar]
- Draine, B. T., & Salpeter, E. E. 1979, ApJ, 231, 438 [NASA ADS] [CrossRef] [Google Scholar]
- Dunne, L., Eales, S., Ivison, R., Morgan, H., & Edmunds, M. 2003, Nature, 424, 285 [NASA ADS] [CrossRef] [PubMed] [Google Scholar]
- Dunne, L., Maddox, S. J., Ivison, R. J., et al. 2009, MNRAS, 394, 1307 [NASA ADS] [CrossRef] [Google Scholar]
- Dwek, E. 2004, ApJ, 607, 848 [NASA ADS] [CrossRef] [Google Scholar]
- Dwek, E., & Cherchneff, I. 2011, ApJ, 727, 63 [NASA ADS] [CrossRef] [Google Scholar]
- Dwek, E., & Scalo, J. M. 1980, ApJ, 239, 193 [NASA ADS] [CrossRef] [Google Scholar]
- Dwek, E., Galliano, F., & Jones, A. P. 2007, ApJ, 662, 927 [NASA ADS] [CrossRef] [Google Scholar]
- Dwek, E., Staguhn, J. G., Arendt, R. G., et al. 2011, ApJ, 738, 36 [NASA ADS] [CrossRef] [Google Scholar]
- Dwek, E., Staguhn, J., Arendt, R. G., et al. 2014, ApJ, 788, L30 [NASA ADS] [CrossRef] [Google Scholar]
- Ercolano, B., Barlow, M. J., & Sugerman, B. E. K. 2007, MNRAS, 375, 753 [NASA ADS] [CrossRef] [Google Scholar]
- Ferrarotti, A. S., & Gail, H. P. 2006, A&A, 447, 553 [NASA ADS] [CrossRef] [EDP Sciences] [Google Scholar]
- Finkelstein, S. L., Papovich, C., Dickinson, M., et al. 2013, Nature, 502, 524 [NASA ADS] [CrossRef] [Google Scholar]
- Gall, C., Andersen, A. C., & Hjorth, J. 2011a, A&A, 528, A13 [NASA ADS] [CrossRef] [EDP Sciences] [Google Scholar]
- Gall, C., Andersen, A. C., & Hjorth, J. 2011b, A&A, 528, A14 [NASA ADS] [CrossRef] [EDP Sciences] [Google Scholar]
- Gall, C., Hjorth, J., & Andersen, A. C. 2011c, A&ARv, 19, 43 [NASA ADS] [CrossRef] [Google Scholar]
- Gall, C., Hjorth, J., Watson, D., et al. 2014, Nature, 511, 326 [NASA ADS] [CrossRef] [Google Scholar]
- Gallagher, J. S., Sugerman, B. E. K., Clayton, G. C., et al. 2012, ApJ, 753, 109 [NASA ADS] [CrossRef] [Google Scholar]
- Gallerani, S., Maiolino, R., Juarez, Y., et al. 2010, A&A, 523, A85 [NASA ADS] [CrossRef] [EDP Sciences] [Google Scholar]
- Gehrz, R. 1989, in Interstellar Dust, eds. L. J. Allamandola, & A. G. G. M. Tielens, IAU Symp., 135, 445 [Google Scholar]
- Gomez, H. L., Dunne, L., Eales, S. A., Gomez, E. L., & Edmunds, M. G. 2005, MNRAS, 361, 1012 [NASA ADS] [CrossRef] [Google Scholar]
- Gomez, H. L., Dunne, L., Ivison, R. J., et al. 2009, MNRAS, 397, 1621 [NASA ADS] [CrossRef] [Google Scholar]
- Gomez, H. L., Krause, O., Barlow, M. J., et al. 2012, ApJ, 760, 96 [NASA ADS] [CrossRef] [Google Scholar]
- Green, D. A., Tuffs, R. J., & Popescu, C. C. 2004, MNRAS, 355, 1315 [NASA ADS] [CrossRef] [Google Scholar]
- Grootes, M. W., Tuffs, R. J., Popescu, C. C., et al. 2013, ApJ, 766, 59 [NASA ADS] [CrossRef] [Google Scholar]
- Hirashita, H. 2000, PASJ, 52, 585 [NASA ADS] [Google Scholar]
- Hirashita, H. 2012, MNRAS, 422, 1263 [NASA ADS] [CrossRef] [Google Scholar]
- Hirashita, H., & Kuo, T. M. 2011, MNRAS, 416, 1340 [NASA ADS] [CrossRef] [Google Scholar]
- Hirashita, H., Ferrara, A., Dayal, P., & Ouchi, M. 2014, MNRAS, 443, 1704 [NASA ADS] [CrossRef] [Google Scholar]
- Hjorth, J., Vreeswijk, P. M., Gall, C., & Watson, D. 2013, ApJ, 768, 173 [Google Scholar]
- Hjorth, J., Gall, C., & Michałowski, M. J. 2014, ApJ, 782, L23 [NASA ADS] [CrossRef] [Google Scholar]
- Hu, E. M., Cowie, L. L., McMahon, R. G., et al. 2002, ApJ, 568, L75 [NASA ADS] [CrossRef] [Google Scholar]
- Iglesias-Páramo, J., Buat, V., Hernández-Fernández, J., et al. 2007, ApJ, 670, 279 [NASA ADS] [CrossRef] [Google Scholar]
- Indebetouw, R., Matsuura, M., Dwek, E., et al. 2014, ApJ, 782, L2 [NASA ADS] [CrossRef] [Google Scholar]
- Iye, M., Ota, K., Kashikawa, N., et al. 2006, Nature, 443, 186 [NASA ADS] [CrossRef] [PubMed] [Google Scholar]
- Kanekar, N., Wagg, J., Ram Chary, R., & Carilli, C. L. 2013, ApJ, 771, L20 [NASA ADS] [CrossRef] [Google Scholar]
- Kippenhahn, R., & Weigert, A. 1990, Stellar Structure and Evolution (Berlin: Springer) [Google Scholar]
- Kotak, R., Meikle, W. P. S., Farrah, D., et al. 2009, ApJ, 704, 306 [NASA ADS] [CrossRef] [Google Scholar]
- Krause, O., Birkmann, S. M., Rieke, G. H., et al. 2004, Nature, 432, 596 [NASA ADS] [CrossRef] [PubMed] [Google Scholar]
- Kuo, T. M., & Hirashita, H. 2012, MNRAS, 424, L34 [NASA ADS] [CrossRef] [Google Scholar]
- Lakićević, M., van Loon, J. T., Meixner, M., et al. 2015, ApJ, 799, 50 [NASA ADS] [CrossRef] [Google Scholar]
- Lee, H., Koo, B., Moon, D., et al. 2009, ApJ, 706, 441 [NASA ADS] [CrossRef] [Google Scholar]
- Maiolino, R., Schneider, R., Oliva, E., et al. 2004, Nature, 431, 533 [NASA ADS] [CrossRef] [PubMed] [Google Scholar]
- Matsuura, M., Barlow, M., Zijlstra, A., et al. 2009, MNRAS, 396, 918 [NASA ADS] [CrossRef] [Google Scholar]
- Matsuura, M., Dwek, E., Meixner, M., et al. 2011, Science, 333, 1258 [NASA ADS] [CrossRef] [Google Scholar]
- Matsuura, M., Woods, P. M., & Owen, P. J. 2013, MNRAS, 429, 2527 [NASA ADS] [CrossRef] [Google Scholar]
- Mattsson, L. 2011, MNRAS, 414, 781 [NASA ADS] [CrossRef] [Google Scholar]
- Mattsson, L., & Andersen, A. C. 2012, MNRAS, 423, 38 [NASA ADS] [CrossRef] [Google Scholar]
- Meikle, W. P. S., Mattila, S., Pastorello, A., et al. 2007, ApJ, 665, 608 [NASA ADS] [CrossRef] [Google Scholar]
- Meixner, M., Gordon, K. D., Indebetouw, R., et al. 2006, AJ, 132, 2268 [NASA ADS] [CrossRef] [Google Scholar]
- Michałowski, M. J., Hjorth, J., Castro Cerón, J. M., & Watson, D. 2008, ApJ, 672, 817 [NASA ADS] [CrossRef] [Google Scholar]
- Michałowski, M. J., Hjorth, J., Malesani, D., et al. 2009, ApJ, 693, 347 [NASA ADS] [CrossRef] [Google Scholar]
- Michałowski, M., Hjorth, J., & Watson, D. 2010a, A&A, 514, A67 [NASA ADS] [CrossRef] [EDP Sciences] [Google Scholar]
- Michałowski, M. J., Murphy, E. J., Hjorth, J., et al. 2010b, A&A, 522, A15 [NASA ADS] [CrossRef] [EDP Sciences] [Google Scholar]
- Michałowski, M. J., Watson, D., & Hjorth, J. 2010c, ApJ, 712, 942 [NASA ADS] [CrossRef] [Google Scholar]
- Michałowski, M. J., Dunlop, J. S., Cirasuolo, M., et al. 2012, A&A, 541, A85 [NASA ADS] [CrossRef] [EDP Sciences] [Google Scholar]
- Michałowski, M. J., Hayward, C. C., Dunlop, J. S., et al. 2014, A&A, 571, A75 [NASA ADS] [CrossRef] [EDP Sciences] [Google Scholar]
- Morgan, H. L., & Edmunds, M. G. 2003, MNRAS, 343, 427 [NASA ADS] [CrossRef] [EDP Sciences] [Google Scholar]
- Morgan, H. L., Dunne, L., Eales, S. A., Ivison, R. J., & Edmunds, M. G. 2003, ApJ, 597, L33 [NASA ADS] [CrossRef] [Google Scholar]
- Mortlock, D. J., Warren, S. J., Venemans, B. P., et al. 2011, Nature, 474, 616 [NASA ADS] [CrossRef] [PubMed] [Google Scholar]
- Nanni, A., Bressan, A., Marigo, P., & Girardi, L. 2013, MNRAS, 434, 2390 [NASA ADS] [CrossRef] [Google Scholar]
- Nanni, A., Bressan, A., Marigo, P., & Girardi, L. 2014, MNRAS, 438, 2328 [NASA ADS] [CrossRef] [Google Scholar]
- Nozawa, T., Kozasa, T., Umeda, H., Maeda, K., & Nomoto, K. 2003, ApJ, 598, 785 [NASA ADS] [CrossRef] [Google Scholar]
- Nozawa, T., Asano, R. S., Hirashita, H., & Takeuchi, T. T. 2015, MNRAS, 447, L16 [NASA ADS] [CrossRef] [Google Scholar]
- Ota, K., Walter, F., Ohta, K., et al. 2014, ApJ, 792, 34 [NASA ADS] [CrossRef] [Google Scholar]
- Ouchi, M., Ono, Y., Egami, E., et al. 2009, ApJ, 696, 1164 [NASA ADS] [CrossRef] [Google Scholar]
- Ouchi, M., Ellis, R., Ono, Y., et al. 2013, ApJ, 778, 102 [NASA ADS] [CrossRef] [Google Scholar]
- Perley, D. A., Bloom, J. S., Klein, C. R., et al. 2010, MNRAS, 406, 2473 [NASA ADS] [CrossRef] [Google Scholar]
- Rémy-Ruyer, A., Madden, S. C., Galliano, F., et al. 2014, A&A, 563, A31 [NASA ADS] [CrossRef] [EDP Sciences] [Google Scholar]
- Rho, J., Kozasa, T., Reach, W. T., et al. 2008, ApJ, 673, 271 [NASA ADS] [CrossRef] [Google Scholar]
- Rho, J., Reach, W. T., Tappe, A., et al. 2009, ApJ, 700, 579 [NASA ADS] [CrossRef] [Google Scholar]
- Riebel, D., Srinivasan, S., Sargent, B., & Meixner, M. 2012, ApJ, 753, 71 [NASA ADS] [CrossRef] [Google Scholar]
- Riechers, D. A., Bradford, C. M., Clements, D. L., et al. 2013, Nature, 496, 329 [Google Scholar]
- Rowlands, K., Gomez, H. L., Dunne, L., et al. 2014, MNRAS, 441, 1040 [NASA ADS] [CrossRef] [MathSciNet] [Google Scholar]
- Sakon, I., Onaka, T., Wada, T., et al. 2009, ApJ, 692, 546 [Google Scholar]
- Salpeter, E. E. 1955, ApJ, 121, 161 [Google Scholar]
- Sandstrom, K. M., Bolatto, A. D., Stanimirović, S., van Loon, J. T., & Smith, J. D. T. 2009, ApJ, 696, 2138 [NASA ADS] [CrossRef] [Google Scholar]
- Schaerer, D., Boone, F., Zamojski, M., et al. 2015, A&A, 574, A19 [NASA ADS] [CrossRef] [EDP Sciences] [Google Scholar]
- Schneider, R., Valiante, R., Ventura, P., et al. 2014, MNRAS, 442, 1440 [NASA ADS] [CrossRef] [Google Scholar]
- Sibthorpe, B., Ade, P. A. R., Bock, J. J., et al. 2010, ApJ, 719, 1553 [NASA ADS] [CrossRef] [Google Scholar]
- Silva, L., Granato, G. L., Bressan, A., & Danese, L. 1998, ApJ, 509, 103 [NASA ADS] [CrossRef] [Google Scholar]
- Sloan, G. C., Matsuura, M., Zijlstra, A. A., et al. 2009, Science, 323, 353 [NASA ADS] [CrossRef] [PubMed] [Google Scholar]
- Srinivasan, S., Meixner, M., Leitherer, C., et al. 2009, AJ, 137, 4810 [NASA ADS] [CrossRef] [Google Scholar]
- Sternberg, A. 1998, ApJ, 506, 721 [NASA ADS] [CrossRef] [Google Scholar]
- Stratta, G., Maiolino, R., Fiore, F., & D’Elia, V. 2007, ApJ, 661, L9 [NASA ADS] [CrossRef] [Google Scholar]
- Sugerman, B., Ercolano, B., Barlow, M., et al. 2006, Science, 313, 196 [NASA ADS] [CrossRef] [PubMed] [Google Scholar]
- Swinbank, A. M., Karim, A., Smail, I., et al. 2012, MNRAS, 427, 1066 [NASA ADS] [CrossRef] [Google Scholar]
- Temim, T., & Dwek, E. 2013, ApJ, 774, 8 [NASA ADS] [CrossRef] [Google Scholar]
- Temim, T., Slane, P., Arendt, R. G., & Dwek, E. 2012, ApJ, 745, 46 [NASA ADS] [CrossRef] [Google Scholar]
- Todini, P., & Ferrara, A. 2001, MNRAS, 325, 726 [NASA ADS] [CrossRef] [Google Scholar]
- Valiante, R., Schneider, R., Bianchi, S., & Andersen, A. C. 2009, MNRAS, 397, 1661 [NASA ADS] [CrossRef] [Google Scholar]
- Valiante, R., Schneider, R., Salvadori, S., & Bianchi, S. 2011, MNRAS, 416, 1916 [NASA ADS] [CrossRef] [Google Scholar]
- Valiante, R., Schneider, R., Salvadori, S., & Gallerani, S. 2014, MNRAS, 444, 2442 [NASA ADS] [CrossRef] [Google Scholar]
- Venemans, B. P., McMahon, R. G., Walter, F., et al. 2012, ApJ, 751, L25 [Google Scholar]
- Ventura, P., Criscienzo, M. D., Schneider, R., et al. 2012, MNRAS, 424, 2345 [NASA ADS] [CrossRef] [Google Scholar]
- Watson, D., Christensen, L., Knudsen, K. K., et al. 2015, Nature, 519, 327 [NASA ADS] [CrossRef] [Google Scholar]
- Wesson, R., Barlow, M. J., Ercolano, B., et al. 2009, MNRAS, 403, 474 [Google Scholar]
- Wilson, T. L., & Batrla, W. 2005, A&A, 430, 561 [NASA ADS] [CrossRef] [EDP Sciences] [Google Scholar]
- Wright, E. L. 2006, PASP, 118, 1711 [NASA ADS] [CrossRef] [Google Scholar]
- Zafar, T., & Watson, D. 2013, A&A, 560, A26 [NASA ADS] [CrossRef] [EDP Sciences] [Google Scholar]
- Zafar, T., Watson, D. J., Malesani, D., et al. 2010, A&A, 515, A94 [NASA ADS] [CrossRef] [EDP Sciences] [Google Scholar]
- Zafar, T., Watson, D. J., Tanvir, N. R., et al. 2011, ApJ, 735, 2 [NASA ADS] [CrossRef] [Google Scholar]
- Zhukovska, S., & Henning, T. 2013, A&A, 555, A99 [NASA ADS] [CrossRef] [EDP Sciences] [Google Scholar]
- Zhukovska, S., Gail, H. P., & Trieloff, M. 2008, A&A, 479, 453 [NASA ADS] [CrossRef] [EDP Sciences] [Google Scholar]
All Tables
All Figures
|
Fig. 1 Dust yield per AGB star (top) and per SN (bottom) required to explain dust masses measured in z> 6.3 galaxies for all possible combinations of dust and stellar masses (Table 1; the points were shifted slightly in redshift for clarity). Symbols are colour-coded according to the way the stellar mass was estimated: from SED modelling (black), assuming that the stellar mass is the difference between the dynamical and gas masses (yellow), or that it is equal to the dynamical mass (red). Filled circles, crosses, and open circles denote the assumption of the Chabrier, Salpeter (α = 2.35), and top-heavy (α = 1.5) IMFs, respectively. Small symbols with arrows correspond to galaxies with only upper limits for dust masses (lower part of Table 1). |
| In the text | |
Current usage metrics show cumulative count of Article Views (full-text article views including HTML views, PDF and ePub downloads, according to the available data) and Abstracts Views on Vision4Press platform.
Data correspond to usage on the plateform after 2015. The current usage metrics is available 48-96 hours after online publication and is updated daily on week days.
Initial download of the metrics may take a while.