Fig. 1
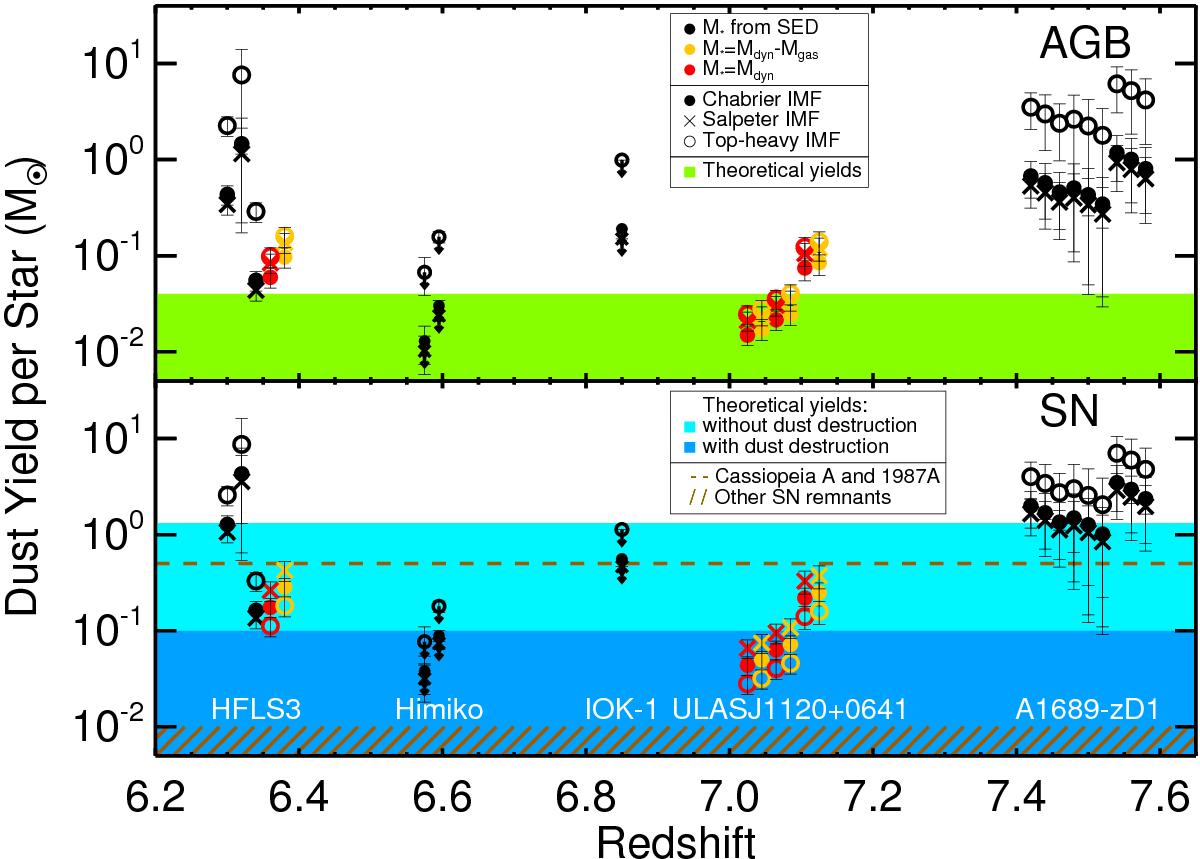
Dust yield per AGB star (top) and per SN (bottom) required to explain dust masses measured in z> 6.3 galaxies for all possible combinations of dust and stellar masses (Table 1; the points were shifted slightly in redshift for clarity). Symbols are colour-coded according to the way the stellar mass was estimated: from SED modelling (black), assuming that the stellar mass is the difference between the dynamical and gas masses (yellow), or that it is equal to the dynamical mass (red). Filled circles, crosses, and open circles denote the assumption of the Chabrier, Salpeter (α = 2.35), and top-heavy (α = 1.5) IMFs, respectively. Small symbols with arrows correspond to galaxies with only upper limits for dust masses (lower part of Table 1).
Current usage metrics show cumulative count of Article Views (full-text article views including HTML views, PDF and ePub downloads, according to the available data) and Abstracts Views on Vision4Press platform.
Data correspond to usage on the plateform after 2015. The current usage metrics is available 48-96 hours after online publication and is updated daily on week days.
Initial download of the metrics may take a while.