| Issue |
A&A
Volume 577, May 2015
|
|
|---|---|---|
| Article Number | A14 | |
| Number of page(s) | 14 | |
| Section | Extragalactic astronomy | |
| DOI | https://doi.org/10.1051/0004-6361/201425224 | |
| Published online | 23 April 2015 | |
Mass-metallicity relation of zCOSMOS galaxies at z ≈ 0.7, its dependence on star formation rate, and the existence of massive low-metallicity galaxies⋆
1
University of ViennaDepartment of Astrophysics,
Tuerkenschanzstrasse 17,
1180
Vienna,
Austria
e-mail:
christian.maier@univie.ac.at
2
Institute of Astronomy, ETH Zurich, 8093
Zurich,
Switzerland
3
Institut de Recherche en Astrophysique et Planétologie, CNRS,
14 avenue Édouard
Belin, 31400
Toulouse,
France
4
IRAP, Université de Toulouse, UPS-OMP, 31400
Toulouse,
France
5
Instituto de Astrofísica de Andalucía, CSIC,
Apartado de correos
3004, 18080
Granada,
Spain
6
INAF−Osservatorio
Astronomico di Bologna, via Ranzani 1, 40127
Bologna,
Italy
7
CEA-Saclay, Orme des Merisiers, Bat. 709, 91191
Gif-sur-Yvette,
France
Received: 27 October 2014
Accepted: 24 February 2015
Aims. The knowledge of the number and physical nature of low-metallicity massive galaxies is crucial for determining and interpreting the mass-metallicity relation (MZR).
Methods. Using VLT-ISAAC near-infrared (NIR) spectroscopy of 39 zCOSMOS 0.5 <z< 0.9 galaxies, we have measured Hα and [ N II ] λ 6584 emission line fluxes for galaxies with [ O II ] λ 3727, Hβ, and [ O III ] λ 5007 available from VIMOS optical spectroscopy. The NIR spectroscopy enables us to break the degeneracy of the R23 method to unambiguously derive O/H gas metallicities and star formation rates (SFRs) from extinction-corrected Hα fluxes.
Results. We used the position in the D4000 vs. [ O III ] λ 5007/Hβ diagram of galaxies with reliable O/Hs from NIR spectroscopy as a benchmark. This enabled us to break the lower or upper branch R23 degeneracy of additional 900 zCOSMOS galaxies at 0.5 <z< 0.9, which do not have measurements of Hα and [ N II ] λ 6584. Additionally, the Hα-based SFR measurements were used to find the best SFR calibration based on [ O II ] λ 3727 for the 0.5 <z< 0.9 zCOSMOS galaxies without Hα measurements. With a larger zCOSMOS sample of star-forming galaxies at z ≈ 0.7 with reliable O/H and SFR measurements, we studied the MZR at z ≈ 0.7 and its dependence on (specific) SFR. We find a fraction of 19% of lower mass 9.5 < log (M/M⊙) < 10.3 zCOSMOS galaxies that shows a larger evolution of the MZR relation than is found in higher mass galaxies; they are more metal poor at a given mass by a factor of 2−3 than SDSS. This indicates that the low-mass MZR slope steepens at z ≈ 0.7 compared to local galaxies. Many of these galaxies with lower metallicity would be missed by studies that assume upper branch R23 solution for all galaxies. The existence of these metal-poor galaxies at z ≈ 0.7 can be interpreted as the chemical version of galaxy downsizing. Moreover, the sample of zCOSMOS galaxies shows direct evidence that the SFR influences the MZR at these redshifts. The measured metallicities for the zCOSMOS sample broadly agree with the values expected for a non-evolving fundamental metallicity relation. This comparison also reveals that galaxies with lower metallicities and typically higher (specific) SFRs, such as found in our zCOSMOS sample at z ≈ 0.7, agree with the predictions of a non-evolving Z(M, SFR).
Key words: galaxies: evolution / galaxies: high-redshift / galaxies: star formation
© ESO, 2015
1. Introduction
Metallicity is one of the most fundamental properties of galaxies. It is a measure of galaxy evolution, reflecting the cycling of gas through stars, and any exchange of gas (inflows or outflows) between the galaxy and its environment. Until inflows and outflows can be observed directly and their mass flow rates can be quantified, measuring the gas-phase metallicities and their relation to stellar mass can provide indirect insights into the impact of these gas flows on the chemical evolution of galaxies over time.
The local Universe has a tight mass-metallicity relation (MZR; Lequeux et al. 1979) with, in SDSS, a relatively steep slope below M ~ 1010.7M⊙ for a Salpeter (1955) initial mass function (IMF), which flattens at higher masses (Tremonti et al. 2004). Measurements of the metallicities of stars and star-forming gas in distant galaxies at significant look-back times (e.g., Hammer et al. 2001; Lilly et al. 2003; Kobulnicky et al. 2003; Maier et al. 2004, 2005, 2006, 2014, 2015; Lamareille et al. 2009; Pérez-Montero et al. 2009; Zahid et al. 2011) have mostly focused on the O/H abundance of star-forming gas as estimated from a number of empirically calibrated metallicity estimators based on the relative strengths of strong emission lines. These studies showed that the MZR at higher redshifts evolves relative to that seen locally. However, the observed shape and evolution of the MZR is probably affected by the selection of the samples and metallicity estimators used.
To estimate the chemical abundances, a number of diagnostics have been developed based on strong lines, including the R23 method first introduced by Pagel et al. (1979). This method is based on the ratio of [ O II ] λ 3727 and [ O III ] λ 5007 to Hβ, corrected for reddening and with the high/low O/H degeneracy broken by the [NII]λ 6584/Hα ratio. Maier et al. (2005, Ma05 in the following) extended the R23 method by simultaneously fitting all of these five lines ([OII], Hβ, [OIII], Hα, and [NII]) to derive the metallicity O/H, the reddening AV, and the ionization parameter q.
Ma05 previously used VLT-ISAAC and Keck-NIRSPEC near-infrared (NIR) spectroscopy to measure Hα and [ N II ] λ 6584 emission line (EL) fluxes for thirty 0.5 <z< 0.9 galaxies extracted from the Canada France Redshift Survey (CFRS; Lilly et al. 1995). Using the additional measured [OII], Hβ and [OIII] EL fluxes from optical spectra, Ma05 measured individual extinction values and reliable metallicities for these CFRS galaxies. They found evidence for a population of galaxies with much lower metallicities than local galaxies with similar luminosities. Their nature is still unclear, and understanding why these probably massive galaxies exhibit low gas metallicities is expected to provide insights into the chemical evolution of the general galaxy population. However, important additional information, namely the morphology and reliable stellar masses, was missing for the studied CFRS sample of galaxies (morphology information was available for only one of the low-metallicity CFRS galaxies). This information is available for zCOSMOS galaxies with possible low metallicities and luminosities similar to those of the studied CFRS galaxies: the morphology from ACS-HST images of the COSMOS field, and reliable stellar masses from a data set spanning a wide wavelength range extending to NIR. Nevertheless, to establish the low metallicity of zCOSMOS objects, NIR spectroscopy is crucial to distinguish between the upper and lower branch of the R23 relation.
Pérez-Montero et al. (2013) used the calibration of the N2 parameter proposed by Pérez-Montero & Contini (2009) at z< 0.5 and the conversion of the R23 relation to this N2 parameter at 0.5 <z< 0.9 to study the MZR of zCOSMOS galaxies. However, while zCOSMOS measurements of [ O II ] λ 3727, Hβ, and [ O III ] λ 5007 fluxes from optical VIMOS spectra of 0.5 <z< 0.9 galaxies were available, the Hα and [NII] measurements required to break the R23 degeneracy were lacking, therefore all objects were assumed to lie on the upper high-metallicity R23 branch. Moreover, no extinction correction using the Balmer decrement between Hα and Hβ could be obtained for the 0.5 <z< 0.9 sample studied by Pérez-Montero et al. (2013), and other less accurate extinction indicators had to be used.
In the local Universe, the O/H ratio at a given mass also depends on the star formation rate (SFR), and thus also specific star formation rate (SSFR) of the galaxy, that is, the SFR is a second parameter in the MZR (e.g., Mannucci et al. 2010, M10 in the following). M10 also claimed that the Z(M, SFR) relation seen in SDSS is also applicable to higher redshift, calling this epoch-independent Z(M, SFR) relation the “fundamental metallicity relation” (FMR). We refer to Maier et al. (2014) for a discussion of the empirical formulations of the Z(M, SFR) by M10, of the physically motivated formulation of the the Z(M, SFR) by Lilly et al. (2013, Li13 in the following), and of the different extrapolations of these Z(M, SFR) relations to higher redshift.
Pérez-Montero et al. (2013) took into account the dependence of metallicity on SFR to derive a SFR-corrected MZR for the zCOSMOS-bright sample. After this correction, an evolution of the SFR-corrected MZR was still observed, implying that the FMR evolves with redshift. On the other hand, Cresci et al. (2012) used a subsample of the 10k zCOSMOS sample (Lilly et al. 2009) with a strong signal-to-noise (S/N) selection and concluded that there is no evolution of the FMR up to z ~ 1. In this paper, we try to reconcile these apparently contradictory results.
The improvement in this paper compared to the studies of Pérez-Montero et al. (2013) and Cresci et al. (2012) is due to the new VLT-ISAAC NIR spectroscopy of Hα and [ N II ] λ 6584, which enables us to derive reliable metallicities based on five ELs for a sample of 39 0.5 <z< 0.9 galaxies, and to use them as a benchmark to break the lower/upper branch R23 degeneracy of other zCOSMOS galaxies at 0.5 <z< 0.9. Additionally, the SFRs based on the extinction-corrected Hα EL flux in the sample with NIR spectroscopy can be used as a benchmark to find the best SFR derivation method based on [ O II ] λ 3727 for the rest of the sample of 0.5 <z< 0.9 galaxies, which does not have measurements of Hα and [ N II ] λ 6584. Moreover, we can use the morphological information available for the zCOSMOS sample.
The paper is structured as follows: in Sect. 2 we present the selection of a parent sample ELOX of zCOSMOS star-forming 0.5 <z< 0.9 galaxies with ELs. The ISAAC-VLT observations of 39 galaxies selected from the sample ELOX are presented next. In Sect. 3 we investigate the active galactic nucleus (AGN) contribution and present the derivation of SFRs, metallicities, extinction parameters, and stellar masses of the 39 galaxies with NIR spectroscopy. We also describe the calibration of the SFRs of the larger ELOX sample, using the ISAAC data. In Sect. 4 we first show that we can break the degeneracy of the R23 relation to derive metallicities of the ELOX sample using the NIR spectroscopy of the 39 galaxies. We then present the SSFR-mass relation and MZR at z ~ 0.7 and investigate their dependence on morphologies. We also investigate whether the SFR affects the MZR and how this compares with predictions of the FMR from different studies. Finally in Sect. 5 we present our conclusions. A concordance-cosmology with H0 = 70 km s-1 Mpc-1, Ω0 = 0.25, ΩΛ = 0.75 is used throughout. Note that metallicity and abundance will be taken to denote oxygen abundance, O/H, throughout unless otherwise specified.
2. Data
2.1. Parent zCOSMOS sample
The zCOSMOS project (Lilly et al. 2007) has been securing spectroscopic redshifts for large numbers of galaxies in the COSMOS field (Scoville et al. 2007). The spectra of about 20 500 IAB ≤ 22.5 selected objects over 1.5 deg2 of the COSMOS field, the so-called zCOSMOS-bright 20k sample, are now all reduced. This sample includes about 1000 stars, about 1500 objects without determined redshift, and about 18 000 galaxies at 0 <z< 1.4 with redshifts measured with different confidence classes (reliabilities).
The success rate of measuring redshifts varies with redshift and is very high (more than 90%) between 0.5 <z< 0.9, the redshift range on which we concentrate in this paper. Spectroscopic observations in zCOSMOS-bright were acquired using VIMOS with the R ~ 600 MR grism over the spectral range 5550−9650 Å. This enables us to measure the [ O II ] λ 3727, Hβ, and [ O III ] λ 5007 line fluxes for galaxies at 0.5 <z< 0.9. For more details about the zCOSMOS survey, we refer to Lilly et al. (2007) for the entire zCOSMOS survey, and to Lilly et al. (2009), where the so-called zCOSMOS-bright 10 k sample is described, a zCOSMOS-bright subsample of about 10 000 objects.
2.2. Selection of EL zCOSMOS galaxies for metallicity studies
From the parent 20 k zCOSMOS sample we first excluded about 1000 stars and then the broad-line AGNs based on broad ELs seen in the VIMOS spectra. Then, only galaxies with reliable redshifts were selected. Specifically, and with reference to the scheme described by Lilly et al. (2009), we used reliable redshifts with confidence classes 2.5, 3.x or 4.x, which yielded a final sample with about 13 500 galaxies at 0 <z< 1.4. For the metallicities study we needed the [ O II ] λ 3727, Hβ, and [ O III ] λ 5007 lines to be covered by the VIMOS spectra; therefore we restricted the zCOSMOS sample to galaxies at redshifts 0.5 <z< 0.9, which left us with a sample of about 7000 objects. About 200 X-ray AGNs were then excluded using the XMM (Brusa et al. 2007), and Chandra COSMOS observations (Elvis et al. 2009).
We considered only objects with a S/N higher than two in the [ O II ] λ 3727, Hβ, and [ O III ] λ 5007 EL fluxes, following the selection of Pérez-Montero et al. (2013), which left a sample of about 2150 EL galaxies. We also excluded about 150 narrow-line AGNs using the blue diagnostic diagram based on [OII], Hβ, and [OIII] and Eq. (1) from Lamareille et al. (2010), as described in Pérez-Montero et al. (2013), their Sect 3.1 and their Fig. 1. Thus the sample is reduced to about 2000 galaxies. This is similar to the number of galaxies used by Pérez-Montero et al. (2013) in this redshift range (cf. their Table 1).
For the O/H determinations we used a subsample of these 2000 galaxies, considering only flag 3.x and 4.x galaxies, and requiring additionally that the [OII], Hβ and [OIII] lines are not affected by strong sky lines (cf. Sect. 2.1.1 in Maier et al. 2009). We also imposed a stricter S/N selection threshold in the EL fluxes of S/N> 3 for [OIII] and S/N> 5 for Hβ, because Hβ and [OIII] are located in a region of the VIMOS spectrum affected by fringing. The S/N> 3 threshold for [OIII] is lower than for Hβ so as not to bias the sample against high-metallicity objects (see Fig. 4 in Foster et al. 2012). Exploring in detail many VIMOS spectra, we found that these values for the S/N of the [OIII] and Hβ fluxes minimize the number of erroneous flux measurements and derived incorrect metallicities. We chose a S/N> 5 for Hβ because closer inspection of spectra of zCOSMOS galaxies with 2 <S/N< 5 in Hβ has revealed that most of them have problematic Hβ in a noisy region of the VIMOS spectrum. Including objects with S/N< 5 in Hβ would imply that unreliable flux measurements with underestimated error bars (because of the fringing) would be used, which would produce spuriously low O/Hs. The applied S/N> 5 selection threshold for Hβ thus minimizes the contamination by spurious metallicities. This left 939 galaxies in the sample ELOX used for our O/H studies. After applying the cut of S/N> 5 for Hβ, 934 out of 939 galaxies, that is, 99.5% of the objects in the ELOX sample, have a S/N> 5 for [OII]. We show in Sect. 4.2, where we discuss selection effects, that our ELOX sample is slightly biased toward higher SSFR at lower masses, especially in the 0.62 <z< 0.75 redshift bin; this selection bias also applies to other samples that select emission line galaxies to study metallicities, like the sample of Zahid et al. (2011) we use for comparison.
2.3. Sample selection for the ISAAC observations
We selected the ISAAC target galaxies from the sample ELOX. To select ISAAC targets, we compared the expected observed wavelength of Hα and [NII] λ 6584 ELs, accurately determined given the zCOSMOS-bright velocity accuracy of ~100 km s-1, with the atlas of OH lines by Lidman et al. from ESO. We excluded objects where the Hα or [NII] λ 6584 were expected to fall on strong night sky lines. Applying an additional Hβ flux lower limit cut of 4 × 10-17erg s-1cm-2 to restrict ISAAC integration times to less than one hour per object, we selected 39 galaxies at 0.5 <z< 0.9 which we observed with ISAAC.
Thirty-five out of the 39 zCOSMOS galaxies are at 0.5 <z< 0.75 (see Table 1). Moreover, 797 ELOX galaxies (85% of the sample ELOX) have redshifts 0.5 <z< 0.75. Therefore we concentrate our discussion on galaxies at 0.5 <z< 0.75 and sometimes split the sample into two redshift bins to study evolution and selection effects as well: 410 galaxies at 0.5 <z< 0.62, and 387 galaxies at 0.62 <z< 0.75.
2.4. ISAAC observations and data reduction
Near-infrared long-slit spectroscopy of 39 zCOSMOS galaxies at 0.5 <z< 0.9 was obtained with the ISAAC spectrograph at the VLT with the aim of measuring their Hα and [ N II ] λ 6584 EL fluxes. The observations were carried out in February and March 2010 (Program 084.B-0312, hereafter P84), and in April and May 2010 and January and February 2011 (Program 085.B-0317, hereafter P85). The medium-resolution grism was used with the short-wavelength channel equipped with a 1024 × 1024 pixel Hawaii array. The pixel scale is 0.147′′ per pixel. We used a slit of 2′′ width for the P84 observations (seeing up to 1.̋5 allowed, ESO priority B), and 1′′ width for the P85 observations (seeing up to 1′′ allowed, ESO priority A), which results in a nominal resolution of R ~ 1500 for P84, and R ~ 3000 for P85.
We used two different filters, the SZ and the J filter, to select the fifth and fourth grating order for measuring the Hα and [ N II ] λ 6584 lines of galaxies at 0.5 <z< 0.65 and 0.65 <z< 0.9. The covered wavelength range was 59 nm and 46 nm when using the J and the SZ filter. The corresponding pixel scales were 0.58 Å/pixel and 0.45 Å/pixel.
The individual integration times varied between 1800 s and 3600 s, depending on the brightness of the Hβ EL flux, which we used to estimate the minimum expected Hα flux. During the observations the telescope was nodded between two positions, A and B, ~10′′ apart along the slit. Dark frames, flat-fields and (Xe+Ar) arc lamp spectra were taken with the same filter, central wavelength, and slit width for each of the targets observed during the night. The conditions were clear during these observations.
Spectra were reduced using the ESO ISAAC pipeline after removing bias and cosmic rays in every single exposure using the IRAF routine cosmicrays. The sequence with A and B representing the two positions along the slit was transformed into ABBA by averaging the As and Bs. The pairs were then subtracted to give A-B, B-A, B-A, and A-B. Wavelength calibration was performed using OH skylines. The subtracted frames contain positive and negative spectra. The two spectra were combined and the resulting frames were then added to give the final result. Flux calibration was made using the broadband magnitudes of the telluric standards. The one-dimensional spectra of each galaxy were extracted using the algorithm by Horne (1986) with an aperture of 10−15 pixels in y-direction, that is, about 1.5−2′′. For more details on data reduction of ISAAC observations we refer to Ma05, where we treated very similar VLT ISAAC spectroscopy of CFRS galaxies at similar redshifts as the zCOSMOS-bright target galaxies.
3. Measurements
3.1. EL fluxes
EL fluxes were measured from the calibrated NIR ISAAC spectra following the procedure described in Ma05. We describe this in detail below. Table 1 reports the EL fluxes (or upper limits) for each galaxy.
-
(i)
We were able to measure Hα in the NIR for all 39galaxies reported in Table 1. We neglectedBalmer absorption in estimating the intrinsic Hα fluxes. For a wide range of star formation histories and forplausible IMFs, the stellar absorption at Hα isalways <5 Å (see, e.g., Brinchmann et al. 2004), smaller than the equivalent widths of the feature in emission in our galaxies and than other sources of uncertainties.
-
(ii)
[OII], Hβ, and [OIII] fluxes were measured for all 39 galaxies using the automatic routine Platefit_VIMOS (Lamareille et al., in prep.). After removing a stellar component using the models of Bruzual & Charlot (2003), Platefit_VIMOS performs a simultaneous fit of all ELs using a Gaussian profile. The Hβ flux was thereby corrected for Balmer absorption, with typical values between 1 and 7 Å used to correct the equivalent width of Hβ. Additionally, an aperture correction to take into account slit losses was applied to each VIMOS spectrum, as described in Maier et al. (2009). Each zCOSMOS spectrum was thereby convolved with the ACS I(814) filter, and then this magnitude was compared with the measured I-band magnitude of the respective galaxy. The difference between the two magnitudes gives the aperture correction factor for each spectrum, with typical aperture correction factors between 1 and 3. This correction assumes that the respective emission line flux and I-band continuum suffer equal slit losses.
-
(iii)
The [ N II ] λ 6584 EL flux was measured for 18 galaxies, but was too faint to be detected for 21 objects. Nevertheless, we were able to determine upper limits for the [ N II ] λ 6584 EL flux of these 21 galaxies because the ISAAC targets were selected such that the [NII] line should avoid strong night sky lines (as described in Sect. 2.3). Table 1 lists the 2σ upper limits for these 21 galaxies.
Given the UV to IR coverage of the spectral energy distribution (SED) of the zCOSMOS objects with 30 bands (Ilbert et al. 2009), we are able to reliably compute the NIR and optical magnitudes from the SED to perform the relative calibration of the EL fluxes measured in the optical and NIR, also in the case of non-photometric spectroscopic observations. Similar to point (ii) above, we also convolved the ISAAC zCOSMOS spectra (we detected the continuum for most ISAAC targets) with the respective NIR filter and compared the resulting magnitude with the measured NIR magnitude to obtain the aperture correction for the ISAAC spectra. In a few cases of the P84 observations we did not detect the continuum in NIR; however, since we used a slit of 2′′ for these observations, the resulting EL fluxes should approximate “total” fluxes (cf. discussion in Sect. 2 of Ma05). The reliability of the relative calibration between the NIR and optical data (necessary to measure the extinction from the Balmer decrement) is reinforced by the good agreement between the SFRs derived from extinction-corrected Hα and the SFRs derived from IRAC and MIPS infrared data (Sect. 3.5).
Observed and derived quantities for the zCOSMOS 0.5 <z< 0.9 galaxies with NIR follow-up spectroscopy.
3.2. BPT (Baldwin, Phillips & Terlevich) diagram
While Pérez-Montero et al. (2013) had to use the “blue BPT” (Lamareille et al. 2010) diagram [OIII]/Hβ vs. [OII]/Hβ to identify type 2 AGNs at 0.5 <z< 0.9, the NIR spectroscopy enables us to use the original BPT (Baldwin et al. 1981) diagram [OIII]/Hβ vs. [NII]/Hα shown in Fig. 1, to establish whether the source of gas ionization is of stellar origin or is associated with AGN activity. The 0.5 <z< 0.9 zCOSMOS galaxies with ISAAC spectroscopy lie below and to the left of the theoretical (solid) curve of Kewley et al. (2001), which separates star-forming galaxies from AGNs, and they lie also below and to the left of the empirical (dashed) curve of Kauffmann et al. (2003). This indicates that in our 0.5 <z< 0.9 zCOSMOS galaxies with ISAAC spectroscopy the dominant source of ionization in the gas is recent star formation.
As described in Sect. 2.2, we excluded narrow line AGNs from the ELOX parent sample using the blue BPT diagram from Lamareille et al. (2010). Therefore, the findings of Fig. 1 indicate that the blue BPT diagram as used by Pérez-Montero et al. (2013) is efficient in removing type 2 AGNs in the zCOSMOS sample.
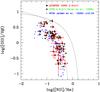 |
Fig. 1 BPT (Baldwin et al. 1981) diagnostic diagram to separate star formation dominated galaxies from AGNs. The zCOSMOS galaxies with ISAAC spectroscopy are shown as filled red circles, z< 1 CFRS galaxies from Ma05 as filled green squares, and local NFGS galaxies from Jansen et al. (2000) as blue points. The zCOSMOS 0.5 <z< 0.9 galaxies lie below and to the left of the theoretical (solid) curve of Kewley et al. (2001) and of the empirical (dashed) curve of Kauffmann et al. (2003), which separate star-forming galaxies (below/left of the curves) from AGNs (above/right of the curves). |
3.3. Deriving oxygen abundances and extinction parameters
To derive oxygen abundances O/H and the extinction parameters AV for the 39 zCOSMOS galaxies with NIR ISAAC spectroscopy, we used the approach described in Ma05. This is based on the models of Kewley & Dopita (2002, KD02), who developed a set of ionization parameter and oxygen abundance diagnostics based on the use of strong rest-frame optical ELs. The method relies on a simultaneous fit to all available EL fluxes (including the [ N II ] λ 6584 upper limits) in terms of extinction parameter AV, ionization parameter q, and O/H, and is described in detail in Ma05. As described in Ma05, we used the wavelength-dependent reddening function f(λ) of Whitford (1958).
Maier et al. (2005, 2006) showed that if [OII], Hβ, [OIII] and Hα are all measured, an upper limit for [NII] λ 6584 often suffices to break the O/H degeneracy and determine oxygen abundances based on the χ2 analysis presented in Ma05. The O/H degeneracy arises because R23 is not a monotonic function of oxygen abundances, meaning that it is double-valued: at a given value of R23 there are two possible choices of the oxygen abundance. The point of the line-fitting approach developed in Ma05 is to use all of the data and the best available emission line models (in this case KD02) without applying other priors that may or may not be valid, in order to compute O/H and thereby also break the R23 degeneracy if the data quality allows. The resulting metallicities for the zCOSMOS galaxies with NIR spectroscopy are given in Table 1, including six out of 39 galaxies with a double-valued O/H measurement. The data quality did not suffice, that is, the upper limits of [NII] λ 6584 of these six galaxies were not enough to break the upper or lower branch degeneracy.
The error bars of O/H and AV that we report in Table 1 are the formal 1σ confidence intervals for the projected best-fitting values. As described in Ma05, the error bars of the oxygen abundance (or AV) are given by the range of oxygen abundance (or AV) for models with χ2 in the range 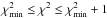 (where
  is the minimum χ2 of all allowed models for a given galaxy), corresponding to a confidence level of 68.3% for one single parameter. A detailed discussion of the calculation of the error bars of O/H and AV, and of the assignment of non-degenerate (not double-valued) oxygen abundances is given by Ma05, and also in Maier et al. (2014).
We would like to mention here that there are two sources of uncertainties for absolute measurements of metallicity: (i) The purely statistical measurement uncertainties propagating through to the parameter determinations. These are addressed by our χ2 analysis. They reflect the quality of the data and the gradients (and degeneracies) in the models. These uncertainties are presented in Table 1. (ii) Uncertainties in the KD02 models. Many different R23 calibrations have been applied to the SDSS data (Kewley & Ellison 2008), and the results indicate a range of ± 0.2 dex in the mean O/H at a given mass − with the KD02 models more or less in the middle. This latter problem is reduced by using the same analysis on all objects and focusing on differential effects with z or M instead of on estimates of the absolute metallicity. Our philosophy is to treat all galaxies at different redshifts and in different samples in the same way and to focus on relative effects between the selected samples. Therefore, when comparing metallicities of the different samples, it is more appropriate to consider uncertainty (i) described above.
3.4. Stellar masses
We used the software HyperzMass for the SED fitting analysis and to estimate the galaxy stellar mass based on the optical to IRAC photometric data from COSMOS. This is a modified version of the public photometric redshift code Hyperz (Bolzonella et al. 2000). HyperzMass fits photometric data points with the Bruzual & Charlot (2003) synthetic stellar population models and selects the best-fit parameters by minimizing the χ2 between observed and model fluxes. The stellar mass is obtained by integrating the SFR over the galaxy age and correcting for the mass loss in the course of stellar evolution.
The choice of the different parameters was discussed and compared by Bolzonella et al. (2010) for the z< 1 redshift regime, and we refer to that paper for details. Specifically, Bolzonella et al. (2010) showed that the stellar mass is a very stable parameter in SED fitting for z< 1 galaxies for a data set such as COSMOS, which spans a wide wavelength range that extends to the NIR. The stellar mass calculated here is always the actual mass of long-lived stars, and when we used literature data, we always corrected for this definition if necessary.
3.5. Star formation rates
One of the most reliable and well-calibrated SFR indicators is the Hα EL. For the 39 zCOSMOS galaxies with NIR spectroscopy, the Hα luminosities (corrected for extinction using the AV values computed as described in Sect. 3.3) were used to calculate the SFRs by applying the Kennicutt (1998) conversion of Hα luminosity into SFR: SFR(M⊙ yr-1) = 7.9 × 10-42L(Hα) erg s-1.
Figure 2 shows the comparison of the SFRs computed using different methods for zCOSMOS galaxies with ISAAC NIR spectroscopy. The SFRs from COSMOS IRAC and MIPS infrared data for the objects with infrared detections were calculated by converting the rest-frame 8 μm luminosity to a dust-corrected Paschen-α luminosity using the calibration from Calzetti et al. (2005), and then converting the Paschen-α luminosity to SFR using a calibration from Osterbrock (1989; for more details see Le Floch et al., in prep.). The mean value of the difference between SFRs from Hα and SFRs from COSMOS IRAC and MIPS is −0.075 dex (panel a of Fig. 2), indicating that SFRs from Hα are typically lower than SFRs from COSMOS IRAC and MIPS by about 16% . However, given the large error bars (see panel a of Fig. 2), the two different methods for measuring SFRs are still consistent with each other. This is reassuring and supports our impression that the Hα-based SFRs are reliable, as is the relative calibration between the NIR and optical data that is required to measure the extinction from the Balmer decrement (cf. Sect. 3.1).
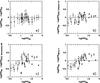 |
Fig. 2 Comparison of SFRs computed using different methods for zCOSMOS galaxies with ISAAC NIR spectroscopy. Panel a) shows a good agreement (within the measurements errors) of the SFRs from ISAAC Hα and SFRs from infrared COSMOS IRAC and MIPS data for the objects with infrared detections (Le Floch et al., in prep.). Panels b)−d) show the comparison of Hα-based SFRs with b) SFRs from the [OII] luminosity, applying the calibration reported by Gilbank et al. (2010), their Eq. (8), and taking into account the erratum of Gilbank et al. (2011) of that paper; c) SFRs derived from the [OII] luminosity using Eq. (2) of Maier et al. (2009), based on the study of Moustakas et al. (2006); and d) SFRs from the Hβ luminosity, assuming AV = 1 (an assumption often used in literature when the Balmer decrement cannot be measured) to derive Hα luminosities. The best agreement between the reliable extinction-corrected Hα -based SFRs and SFRs estimators based on other ELs (panels b)−d)) is depicted in panel b). |
Most of the zCOSMOS-bright galaxies at 0.5 <z< 0.9 do not have NIR measurements of Hα, which means that their SFRs have to be determined using bluer ELs observed with VIMOS, such as Hβ or [OII]. We compare the Hα -based SFRs with SFRs estimators using Hβ and [OII] in panels b−d of Fig. 2. Panel b shows a slight trend toward increasing logSFRHα−log(SFR)[OII] for higher logSFRHα, but this trend is more pronounced in panels c and d (the value for the slope of a linear fit to the data is about twice as high in panels c and d compared to panel b). Moreover, taking the error bars into account, twice as many objects in panels c and d are more than 1σ away from agreement (zero line) than in panel b. Therefore, in the following, when Hα is not available for ELOX galaxies, we use SFRs derived from the [OII] luminosity using the calibration reported by Gilbank et al. (2010) (panel b). The calibration of Gilbank et al. (2010) of [OII]-SFR compensates for the effects of metallicity dependence and dust extinction by applying an empirical mass-dependent correction for the [OII]-SFR relation, which was derived using data in the deeper SDSS Stripe 82 subsample.
3.6. Morphological classification
We used the morphological classification of the COSMOS galaxies based on the Zurich Estimator of Structural Types (ZEST) classification derived by Scarlata et al. (2007). The ZEST classification scheme is based on the principal-component analysis of five non-parametric diagnostics: asymmetry, concentration, Gini coefficient, second-order moment of the brightest 20% of galaxy pixels, and ellipticity. The ZEST scheme morphologically classifies galaxies into three main types: early-type galaxies T1, disk galaxies T2, and irregular galaxies T3. The ELOX sample, selected to be a sample of galaxies with ELs, contains only 13 galaxies (<1.5% of the sample) classified as ZEST early-type T1; therefore we concentrate on types T2 and T3 when discussing morphologies of the ELOX sample.
4. Results
4.1. Breaking the degeneracy in R23 for ELOX sample galaxies without NIR spectroscopy
To break the R23 degeneracy for the 900 galaxies in the ELOX sample without NIR spectroscopy of Hα and [ N II ] λ 6584, one needs an additional indicator. We used the D4000 vs. [ O III ] λ 5007/Hβ diagram for this purpose (Fig. 3).
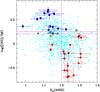 |
Fig. 3 D4000 vs. [ O III ] λ 5007/Hβ diagram used to break the R23 degeneracy for the 0.5 <z< 0.9 zCOSMOS galaxies (cyan points) without NIR spectroscopy. The 39 zCOSMOS galaxies with ISAAC spectroscopy are shown as blue filled circles for galaxies with low (branch) O/H measurements, red filled circles for galaxies with high (branch) O/H measurements, and green filled circles for the six galaxies with double-valued solutions (note that the D4000 and [ O III ] λ 5007/Hβ values of two galaxies are almost identical, i.e., the respective green circles coincide). This diagram can be used to break the lower/upper branch R23 degeneracy of other 0.5 <z< 0.9 galaxies without NIR spectroscopy, but similar D4000 and [OIII]/Hβ as the 33 benchmark galaxies with ISAAC spectroscopy and reliable metallicities. |
The D4000 vs. [ O III ] λ 5007/Hβ values for the zCOSMOS ELOX sample at 0.5 <z< 0.9 are shown as cyan points in Fig. 3. The 33 zCOSMOS galaxies with reliable O/H measurements are shown as blue filled circles for galaxies with low (branch) O/H measurements, and red filled circles for galaxies with high (branch) O/H measurements. Additionally, green filled circles depict the six galaxies with double-valued solutions mentioned in Sect. 3.3. There is a region of the D4000 vs. [ O III ] λ 5007/Hβ diagram with D4000< 1.2 and [OIII]/Hβ> 1.8 (above the upper horizontal magenta line) occupied by galaxies with low (branch) O/Hs (blue symbols), and a region with D4000> 1.2 and [OIII]/Hβ< 1.6 (below the lower horizontal magenta line) occupied by galaxies with high (branch) O/Hs (red symbols). This information can be used to break the lower/upper branch R23 degeneracy of other zCOSMOS ELOX galaxies without NIR spectroscopy, but similar D4000 and [OIII]/Hβ as the 33 benchmark galaxies with ISAAC spectroscopy and reliable metallicities. There are only a few objects in the upper right corner of Fig. 3 (D4000> 1.2 and [OIII]/Hβ> 1.8), ~5% of the ELOX sample, and these are assumed to be on the upper R23 branch, to also account for the fact that a few galaxies with [OIII]/Hβ> 1.8 are expected to be on the upper R23 branch according to Fig. A.1. For the ELOX galaxies in the lower left corner of Fig. 3 (D4000< 1.2 and [OIII]/Hβ< 1.8) we assume that they are on the upper R23 branch because of two indications: (i) the two galaxies in this corner with ISAAC measurements have upper R23 branch metallicities (red filled circles); and (ii) Fig. A.1 in the Appendix indicates that they should have O/H > 8.6, because EL galaxies along the star-forming sequence (between the dashed lines) with [OIII]/Hβ< 1.8 do not lie in the cyan-colored grid area (O/H < 8.6) in Fig. A.1.
Our empirical finding based on the zCOSMOS galaxies with ISAAC spectroscopy is that objects with D4000< 1.2 and [OIII]/Hβ> 1.8 lie on the lower R23 branch when computing O/Hs based on the KD02 models and using five ELs. Our findings are based on the particular form of the KD02 models, especially the particular form of the R23 relation (Fig. 5 in KD02). Using a different parametrization of the R23 relation may possibly give different results. Therefore, we advise caution when using Fig. 3 to select the R23 branch: larger samples of galaxies with five ELs measured are needed to verify that the proposed diagram can really be used to select the R23 branch also for other samples and other metallicity calibrations. We are working on this and also explore the reason why the D4000 vs. [OIII]/Hβ diagram is able to distinguish the R23 branch (and if it always works) using a larger sample of galaxies from the Clash-VLT survey, at slightly lower redshifts 0.4 <z< 0.5. This sample has reliable metalllicities based on all five ELs measured with VIMOS at the same time, including [NII] flux measurements, and not only upper limits, also for high [OIII]/Hβ values. This work will be presented in a future paper (Maier et al., in prep., first results shown in Kuchner et al. 2015).
This method for breaking the R23 degeneracy for ~1010M⊙ galaxies cannot be derived or improved using the larger SDSS local sample of galaxies because virtually no galaxy in the SDSS sample has such a high [ O III ] λ 5007/Hβ line ratio at similar stellar masses like the low-metalllicity zCOSMOS galaxies with ISAAC spectroscopy shown in Fig. 3. This is indicated, for instance, by the orange contours in the upper panel of Fig. 7 of Holden et al. (2014), depicting the [ O III ] λ 5007/Hβ line ratios as a function of stellar mass for star-forming (not dominated by AGNs) SDSS galaxies.
As described in Sect. 2.3, the galaxies with ISAAC spectroscopy were selected to have a minimum Hβ flux limit. Nevertheless, Fig. 4 shows that ISAAC target galaxies (large colored squares and triangles) occupy a similar region of the SSFR-mass diagram as the ELOX sample. Therefore, there should be no selection bias of the ISAAC sample compared to the ELOX sample.
To derive O/H for the ELOX galaxies without NIR spectroscopy of Hα and [NII], but [OII], Hβ and [OIII] fluxes measured with VIMOS, we proceeded as follows: as described in Ma05, [NII]/Hα basically only determines the R23 branch, and the R23 diagnostic is used to determine the exact value of the metallicity on the respective branch. Therefore, we do not need the value of [NII]/Hα, but we used Fig. 3 instead to estimate which branch is appropriate for each galaxy, as described above. When using our χ2 analysis presented in Sect. 3.3, we allowed the Hα/ Hβ ratio to vary a priori in a typical range 2.86−6, corresponding to typical extinction values of star-forming galaxies of 0 <AV< 2.1, as found for the zCOSMOS galaxies with ISAAC spectroscopy (see Table 1). This way, we obtain an estimate for metallicity O/H, reddening AV, and ionization parameter q for the entire ELOX sample.
4.2. SSFR-mass relation at z ≈ 0.7 and selection effects
The specific SFR (SSFR) has been found to be a tight but weak function of mass at all epochs up to z ~ 2 for (most) star-forming galaxies (main sequence, MS), and to evolve strongly with epoch by a factor of 20 to z ~ 2 (Daddi et al. 2007; Elbaz et al. 2007; Noeske et al. 2007; Salim et al. 2007; Peng et al. 2010). The dashed black (almost horizontal) lines in Fig. 4 show the SSFRs calculated using Eq. (1) of Peng et al. (2010) for the MS at z = 0.5 and z = 0.62 (left panels), and at z = 0.62 and z = 0.75 (right panels), assuming a weak dependence of SSFR on mass (as observed for local SDSS galaxies), SSFR ∝ Mβ with β = −0.1. The dispersion of ~0.3 dex about the mean relation is taken into account by the dotted (almost horizontal) lines. We consider as MS objects the galaxies in the region between the dotted lines in Fig. 4.
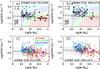 |
Fig. 4 SSFR-mass relation for zCOSMOS galaxies at 0.5 <z< 0.62 (panels a) and c)) and at 0.62 <z< 0.75 (panels b) and d)), with the data points color-coded according to the measured metallicity value (legend in panel c)). The colors of the grid points in panel a) and b) indicate the metallicities expected for the Z(M, SFR) extrapolation of Li13. In panels a) and b), galaxies with ISAAC spectroscopy are shown as colored symbols, while ELOX galaxies with O/H < 8.6 (the respective cyan circles in panels c) and d)) are shown as black symbols as squares (triangles) for T2 (T3) morphologies. In panels c) and d) the large magenta filled circles show the mean values of the SSFRs in three mass bins. ELOX galaxies with lower R23 branch KD02 metallicities, O/H < 8.6, have typically lower masses (9.5 < log (M/M⊙) < 10.3), and preferentially irregular morphologies when they have higher SSFRs. This diagram also indicates that SFR is a second parameter in the MZR of the zCOSMOS sample at 0.5 <z< 0.75, because galaxies with higher (S)SFRs generally also have lower metallicities. |
The SFRs for the zCOSMOS galaxies with ISAAC NIR follow-up (large colored symbols in panels a and b in Fig. 4) were derived from Hα, while for the parent ELOX sample of 797 galaxies at 0.5 <z< 0.75 (panels c and d) we used SFRs derived from [OII] as described in Sect. 3.5. The large magenta filled circles in panels c and d in Fig. 4 indicate the mean SSFR in three mass bins 9.5 ≤ log (M/M⊙) ≤ 10, 10 < log (M/M⊙) ≤ 10.5, and 10.5 < log (M/M⊙) ≤ 11. The position of the mean SSFR relative to the MS in Fig. 4 indicates that the samples at 0.5 <z< 0.62 and at 0.62 <z< 0.75 are quite representative for MS galaxies at the higher masses. At lower masses, the 0.5 <z< 0.62 sample is still dominated by MS galaxies, while 0.62 <z< 0.75 galaxies lie predominantly above the MS, which could bias the low-mass 0.62 <z< 0.75 sample more toward lower metallicities.
The data points in Fig. 4 are color-coded according to their measured metallicity values (legend in panel c). The colors of the grid points in panel a and b indicate the metallicities derived for the Z(M, SFR) from Eq. (40) in Li13. This way, it can be determined whether the measured metallicities (color of the data points) and the expected metallicity assuming a redshift independent Z(M, SFR) relation (color of the grid points) agree. Like in Maier et al. (2014), because M10 and Li13 used a Chabrier (2003) IMF, we converted the masses to a Salpeter (1955) IMF after computing the expected O/Hs (color of the grid points) by adding 0.23 dex to the stellar masses.
When using the calibration of KD02, the upper metallicity R23 branch roughly corresponds to O/H > 8.6 (see Fig. 5 in KD02). The ELOX low-metallicity galaxies with O/H < 8.6 (cyan circles in panels c and d) are shown again as black symbols in panels a and b, to explore their nature. Many of these galaxies with lower metallicity would be missed by studies that assume upper branch R23 solution for all galaxies. They represent ~19% of the ELOX sample and typically have lower masses (9.5 < log (M/M⊙) < 10.3), and preferentially irregular morphologies when they have higher SSFRs.
Our study shows that these low-metallicity galaxies exist at intermediate redshifts because i) first, they lie in a region of the SSFR-mass diagram where some zCOSMOS galaxies with ISAAC spectroscopy and reliable O/H < 8.6 are located as well; ii) second, given their masses and SFRs, the prediction of the Z(M, SFR) extrapolation of Li13 is O/H < 8.6 for most of these galaxies, as shown by the cyan grid points in panels a and b in the region occupied by the majority of the black symbols (which depict galaxies with O/H < 8.6).
4.3. MZR at z ≈ 0.7
Figure 5 shows the MZR of 0.5 <z< 0.75 zCOSMOS galaxies, compared to SDSS. For the local MZR, we converted the oxygen abundances of Tremonti et al. (2004) to the calibration of KD02 using the Kewley & Ellison (2008) conversion, and also converted their stellar masses to a Salpeter (1955) IMF. Sixteenth and 84th percentiles and the medians (50th percentiles) of the distribution of O/H in the respective mass bin are shown as black thick lines for SDSS, and the median SDSS MZR, shifted downward by 0.3, 0.5 and 0.7 dex, respectively, is shown by the three thinner black lines. Our ISAAC based O/H measurements for the 29 galaxies at 0.5 <z< 0.75 with reliable metallicity measurements are shown as larger green filled circles, while the zCOSMOS ELOX measurements are shown as small filled red circles.
The O/H measurements from the work of Zahid et al. (2011) using more than 1000 galaxies from the Deep Extragalactic Evolutionary Probe 2 (DEEP2) sample at slightly higher redshift, 0.75 <z< 0.82, are shown in Fig. 5 as cyan points. The blue line shows the mean DEEP2 MZR from Eq. (8) in Zahid et al. (2011), converted to the KD02 calibration by applying the conversion given in Table 3 of Kewley & Ellison (2008). The error bars for the stellar masses of the zCOSMOS galaxies observed with ISAAC are reported in Table 1. Stellar masses for the zCOSMOS ELOX sample (red points) and for the DEEP2 sample (cyan points) were shown by Bolzonella et al. (2010) and Zahid et al. (2011) to be reliable within 0.2−0.3 dex, that is, to within a factor 1.5−2.
We now discuss the consistency of the measurements of masses and metallicities between the SDSS and the zCOSMOS sample. Because we used the method described by Horne (1986), the line ratios measured for zCOSMOS galaxies, which are used to derive metallicities, are dominated by the inner regions of galaxies (with the largest surface brightness). This is roughly consistent with the measurements from SDSS spectra that are taken by placing fibers on the centers of galaxies. Figure 18 of Moustakas et al. (2013) shows the comparison between stellar masses from SDSS and from SED fitting, which indicates that the two methods of estimating stellar masses are consistent within the uncertainties.
Zahid et al. (2011) found that high stellar mass galaxies with log (M/M⊙) ~ 10.8 (and higher masses) have metallicities similar to the SDSS sample, only 0.05 dex lower, which is within the errors of the metallicity calibration conversions. For lower masses they found that the metallicity difference increases, up to ~0.15 dex for galaxies with log (M/M⊙) ~9.4, indicating that the low-mass MZR slope steepens at higher redshift compared to local galaxies. The mean O/H values, in three mass bins, of zCOSMOS galaxies at 0.62 <z< 0.75, shown as large magenta filled circles in Fig. 5, agree with the DEEP2 mean relation reported by Zahid et al. (2011) at similar (slightly higher) redshifts 0.75 <z< 0.82. This indicates that the MZR evolves to lower metallicities with increasing redshift and that the low-mass MZR slope steepens at z ≈ 0.7; the selection biases toward higher SSFRs at lower masses (especially in the higher redshift bin 0.62 <z< 0.75), as shown in the panels c and d of Fig. 4, may play a role by suggesting a larger evolution of the MZR compared to the intrinsic evolution.
While both zCOSMOS and DEEP2 galaxies at z ~ 0.5−0.8 have similar (slightly lower) metallicity at the higher masses compared to z ~ 0, a population of galaxies with metallicities lower by a factor of 2−3 compared to SDSS exists at the lowest masses probed by zCOSMOS and DEEP2. Given the metallicity uncertainties, this offset toward lower metallicities at a given mass at z ~ 0.5−0.8 agrees, at least for the highest masses, with the value of 0.12 dex found by Pérez-Montero et al. (2013) for the zCOSMOS sample at 0.6 <z< 0.8 when restricting their sample to a selection with a S/N> 5 in Hβ, but assuming upper branch of R23 for all objects (Table 3 in Pérez-Montero et al. 2013). On the other hand, at the lower masses we find more lower metallicity galaxies than were reported in the study of Pérez-Montero et al. (2013) because we broke the R23 degeneracy for the ELOX sample as described in Sect. 4.1.
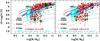 |
Fig. 5 MZR of zCOSMOS ELOX 0.5 <z< 0.75 galaxies (red circles) and galaxies with O/H measurements based on additional ISAAC spectroscopy (green filled circles), compared to the local MZR of Tremonti et al. (2004) and the MZR at 0.75 <z< 0.82 found by Zahid et al. (2011) using the DEEP2 sample. The individual DEEP2 data are shown as cyan symbols, while the mean DEEP2 MZR from Eq. (8) in Zahid et al. (2011), converted to the KD02 calibration, is shown as a blue line. The mean O/H values of zCOSMOS galaxies in three mass bins are shown as large magenta filled circles. While both zCOSMOS and DEEP2 galaxies at z ~ 0.5−0.8 have similar (slightly lower) metallicities at the higher masses compared to z ~ 0, a population of galaxies with metallicities lower by a factor 2−3 than SDSS exists at the lowest masses probed by zCOSMOS and DEEP2. |
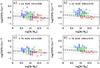 |
Fig. 6 SSFR-mass relation for the ELOX galaxies at 0.5 <z< 0.62 (panels a) and c)) and at 0.62 <z< 0.75 (panels b) and d)), with the lower panels showing only galaxies with T2 (disk) morphologies. Open circles depict the mean (color-coded as in Fig. 4) metallicity data of ELOX galaxies at the position of grid points with at least three ELOX galaxies within ± 0.05 dex in logSFR and logM from the SSFR and mass values of the respective grid point. It seems that the SFR is a second parameter in the MZR of the zCOSMOS sample at 0.5 <z< 0.75, because galaxies with higher (S)SFRs generally also have lower metallicities. |
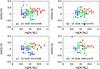 |
Fig. 7 Difference between the mean O/H at the position of grid points (color-coded as in Fig. 4) and the expected O/H from the formulations of Li13 (open circles) and M10 (filled circles). ELOX galaxies at 0.5 <z< 0.62 are shown in panels a) and c), and at 0.62 <z< 0.75 in panels b) and d), with the lower panels showing only galaxies with T2 (disk) morphologies. Because typical O/H uncertainties are 0.1−0.2 dex, the agreement between the measured and expected O/Hs is quite good, especially in panel c). |
The lower number of low-mass (9.5 < log (M/M⊙) < 10) galaxies with high metallicities at 0.62 <z< 0.75 compared to 0.5 <z< 0.62 is very likely due to the selection effects shown in Fig. 4 and discussed in Sect. 4.2. More MS galaxies at z> 0.62 at the lower masses and lower SSFRs are missed from the sample than at z< 0.62: the magenta symbol showing the mean SSFR at 9.5 < log (M/M⊙) ≤ 10 at z> 0.62 (panel d of Fig. 4) lies above the MS. This shows that, at higher redshifts, selection effects can produce a much steeper MZR (because of the missing low-mass, low-SFR, high-metallicity galaxies) than an unbiased sample. Any conclusion on the evolution of the MZR slope with redshift must therefore be treated with caution; therefore we do not plot in Fig. 5 the mean MZR relation of the ELOX sample, and do not discuss the exact value of the low-mass slope of the MZR of the ELOX sample. Nevertheless, we find indications that the low-mass MZR slope steepens more at z ≈ 0.7 than it does for local galaxies.
The existence of ~1010M⊙ z ≈ 0.7 galaxies with metallicities lower by a factor of 2−3 than local similar mass galaxies can be interpreted as the chemical version of galaxy downsizing (cf. Maier et al. 2006). Downsizing was originally introduced by Cowie et al. (1996) to describe the observational fact that a mass threshold decreases (in mass) with cosmic time. Cowie et al. (1996) showed that a threshold in mass exists below which “forming galaxies” (with their timescale of formation M/SFR shorter than the Hubble time at that redshift) were found and above which they were not found. This concept has been generalized and applied to any situation in which signatures of galaxy youth exhibit a similar mass threshold that decreases with epoch. Irregular morphologies, blue colors, high equivalent width ELs, and, as earlier argued in Maier et al. (2006), low O/Hs, have been used as signatures of galaxy youth. As shown in Fig. 5 for the case of chemical downsizing, the mass threshold for finding low metallicities decreases from ~2 × 10¹⁰M⊙ at z ≈ 0.7 to below ~3 × 10⁹M⊙ for local SDSS galaxies, which, at ~3 × 10⁹M⊙, still exhibit quite high metallicities (O/Hs higher than ~8.6).
4.4. SFR as a second parameter in MZR, and the FMR
Figure 4 already indicates that SFR is a second parameter in the MZR of zCOSMOS galaxies at 0.5 <z< 0.75, because, at a given mass, galaxies with higher (S)SFRs generally also have lower metallicities (color of the data points). To explore this in more detail, we use Fig. 6, a different version of the SSFR-mass relation for the zCOSMOS ELOX galaxies at 0.5 <z< 0.62 (panels a and c) and at 0.62 <z< 0.75 (panels b and d), with the lower panels showing only galaxies with T2 (disk) morphologies. We calculated, for each point in the SSFR − mass grid, the mean values of the O/H for galaxies in the ELOX sample within ± 0.05 dex in log SFR and log M around the (SFR, mass) values at the respective grid point. We show as open circles in Fig. 6 the mean metallicity data (color-coded as in the legend of Fig. 4) of ELOX galaxies at the position of grid points with at least three ELOX galaxies within ± 0.05 dex around the (SFR, mass) values at the respective grid point. Figure 6 shows that, in general, at a given stellar mass, galaxies with lower SSFRs have higher O/Hs (red circles, O/H > 8.95) than higher SSFR objects, which have lower O/Hs (8.8 < O/H < 8.95, green circles) and even lower 8.6 < O/H < 8.8 (blue circles) for higher SSFRs. Thus, a dependency of the MZR of 0.5 <z< 0.75 zCOSMOS galaxies on SFR exists.
Figure 7 shows the difference between the mean O/H at the position of grid points (color-coded as in Fig. 4) and the expected O/H from the formulations of Li13 (open circles) and M10 (filled circles). Most disk (T2) galaxies agree with the predictions of M10 (their Eq. (2)) and Li13 FMR, particularly at 0.5 <z< 0.62, where these disk galaxies mainly lie on the main sequence (panels c of Figs. 6 and 7). Given the uncertainties in measuring metallicities of typically 0.1−0.2 dex, the agreement between the measured and expected O/Hs from both Li13 and Ma10 formulations of the Z (M, SFR) is quite good.
4.5. Comparison with other zCOSMOS work on Z(M, SFR)
Because the absolute O/H values of the different works using different metallicity calibrations are not easily comparable, it is difficult to asses whether low-metallicity log M/M⊙~10 galaxies such as those reported here were already presented in other zCOSMOS work. As mentioned in Sect. 4.2, the upper R23 branch of the O/H KD02 calibration we used roughly corresponds to O/H > 8.6. Cresci et al. (2012) used the calibration of Maiolino et al. (2008) with the upper R23 branch extending down to O/H ~ 8.4 (see Fig. 5 in Maiolino et al. 2008). Pérez-Montero et al. (2013) used a different O/H calibration based on or converted to the calibration of the N2 = log [ N II ] λ 6584/Hα parameter proposed by Pérez-Montero & Contini (2009), yielding lower oxygen abundances by a factor of 2−3 than the KD02 calibration.
The criterion used by Cresci et al. (2012) to select low R23 branch objects was log [ OIII ]/[ OII ] > 0.45. There are only two objects with log [ OIII ]/[ OII ] > 0.45 in our zCOSMOS sample with ISAAC spectroscopy, and four galaxies in the zCOSMOS ELOX sample at 0.5 <z< 0.75; this means that according to the criterion of Cresci et al. (2012), virtually all zCOSMOS galaxies would lie on the upper R23 branch of their metallicity calibration. Cresci et al. (2012) used a quite small subsample of zCOSMOS z ~ 0.7 galaxies with a strong S/N selection: S/N> 20 and S/N> 8 in Hβ flux for log (M/M⊙) > 10 and log (M/M⊙) < 10, respectively. This selection biases the sample toward high SFRs, and Cresci et al. (2012) concluded that the Z(M, SFR) is holding up to z ~ 1. On the other hand, Pérez-Montero et al. (2013) used a S/N> 2 in the EL fluxes, which means that they also included galaxies with lower SFRs. They assumed that all galaxies are on the upper R23 branch and found redshift evolution in the Z(M, SFR) relation.
While Cresci et al. (2012) found that “lack of evolution of the FMR at 0.2 <z< 0.8 is fully confirmed for the zCOSMOS sample” using a sample with quite high SFRs, it seems that a S/N> 2 EL flux selection like the one used by Pérez-Montero et al. (2013) to study the Z(M, SFR) contains some galaxies with rather low SFRs that do not follow the Z(M, SFR) relation. The ELOX sample in this work has a S/N> 5 selection in Hβ flux for the reasons given in Sect. 2.2, which is an intermediate S/N limit compared to the samples of Cresci et al. (2012) and Pérez-Montero et al. (2013). We find that most (but not all) galaxies in the zCOSMOS sample are consistent with no evolution in the Z(M, SFR), as shown in Figs. 4, 6, and 7, obtaining an intermediate result compared to the studies of Cresci et al. (2012) and Pérez-Montero et al. (2013). This indicates that the selection of the sample affects the dependence of the MZR on SFR; the effects of the selection of the sample should be explored in future studies by using the SSFR-mass diagram, as we did in Figs. 4, 6, and 7.
5. Conclusions
This study of the MZR and its dependence on SFR at intermediate redshifts is based on ISAAC NIR spectroscopy of 39 zCOSMOS galaxies. The results of the NIR spectroscopy were used as a benchmark to calibrate the metallicities and SFRs of a much larger zCOSMOS sample of 900 galaxies, to study the Z(M, SFR) relation at z ≈ 0.7.
The main results can be summarized as follows:
-
1.
The zCOSMOS galaxies at 0.5 <z< 0.9 with NIR spectroscopy are not dominated by AGNs.
-
2.
We empirically found a criterion to distinguish the lower or upper branch R23, using the position of galaxies with reliable O/Hs in the D4000 vs. [ O III ] λ 5007/Hβ diagram. Our findings indicate that the low-metallicity R23 solution should be chosen for galaxies with D4000< 1.2 and [OIII]/Hβ> 1.8.
-
3.
The MZR relation at z ≈ 0.7 for massive zCOSMOS galaxies is only slightly shifted to lower metallicities compared to the SDSS sample, consistent with the findings of Zahid et al. (2011) at slightly higher redshift z ~ 0.8. There exists a fraction of 19% of lower mass 9.5 < log (M/M⊙) < 10.3 zCOSMOS galaxies that shows a larger evolution of the MZR relation, being more metal poor at a given mass by a factor of 2−3 than the SDSS (Fig. 5). This indicates that the low-mass MZR slope steepens at z ≈ 0.7 compared to local galaxies.
-
4.
The appearance of z ≈ 0.7 intermediate-mass (~1010M⊙) galaxies with metallicities lower by a factor of 2−3 than local galaxies of the same mass can be interpreted as the chemical version of galaxy downsizing (cf. Maier et al. 2006). The mass threshold for finding low metallicities decreases from ~2 × 10¹⁰M⊙ at z ~ 0.7 to below ~3 × 10⁹M⊙ for local SDSS galaxies, which, at ~3 × 10⁹M⊙, still exhibit quite high metallicities (see Fig. 5).
-
5.
We find direct indications that SFR is still a second parameter in the MZR at 0.5 <z< 0.75, in the sense that 0.5 <z< 0.75 galaxies with higher metallicities have lower (S)SFRs (see Figs. 4 and 6).
-
6.
A comparison with the metallicities expected for a non-evolving FMR at z ≈ 0.7 shows that low-metallicity, 9.5 < log (M/M⊙) < 10.3 galaxies as found in the zCOSMOS sample, agree with the predictions of a non-evolving Z(M, SFR) (see Fig. 4). The agreement between the measured metallicities and the predicted metallicities for a non-evolving FMR is good for the entire zCOSMOS ELOX sample (Fig. 7).
-
7.
This study emphasizes that assuming the upper branch R23 metallicity calibration for galaxies at intermediate redshifts would missclassify as metal-rich a substantial portion (up to about 20% in a given mass range) of galaxies that are in truth low-metallicity galaxies.
Acknowledgments
We are grateful the anonymous referees for the suggestions that have improved the clarity of the paper. This publication is supported by the Austrian Science Fund (FWF). We warmly acknowledge the contributions of the entire COSMOS collaboration, consisting of more than 70 scientists.
References
- Asari, N. V., Fernandes, R. C., Stasinska, G., et al. 2007, MNRAS, 381, 263 [NASA ADS] [CrossRef] [MathSciNet] [Google Scholar]
- Baldwin, J. A., Phillips, M. M., & Terlevich, R. 1981, PASP, 93, 5 [NASA ADS] [CrossRef] [EDP Sciences] [Google Scholar]
- Bolzonella, M., Kovac, K., Pozzetti, L., et al. 2000, A&A, 363, 476 [NASA ADS] [Google Scholar]
- Bolzonella, M., Miralles, J.-M., & Pell’o, R. 2010, A&A, 524, A76 [NASA ADS] [CrossRef] [EDP Sciences] [Google Scholar]
- Brinchmann, J., Charlot, S., White, S. D. M., et al. 2004, MNRAS, 351, 1151 [NASA ADS] [CrossRef] [Google Scholar]
- Brusa, M., Zamorani, G., Comastri, A., et al. 2007, ApJS, 172, 353 [NASA ADS] [CrossRef] [Google Scholar]
- Bruzual, G., & Charlot, S. 2003, MNRAS, 344, 1000 [NASA ADS] [CrossRef] [Google Scholar]
- Calzetti, D., Kennicutt, R. C., Jr.,Bianchi, L., et al. 2005, ApJ, 633, 871 [NASA ADS] [CrossRef] [Google Scholar]
- Chabrier, G. 2003, PASP, 115, 763 [NASA ADS] [CrossRef] [Google Scholar]
- Cowie, L. L., Songaila, A., Hu, E. M., & Cohen, J. G. 1996, AJ, 112, 839 [Google Scholar]
- Cresci, G., Mannucci, F., Sommariva, V., et al. 2012, MNRAS, 421, 262 [NASA ADS] [Google Scholar]
- Daddi, E., Dickinson, M., Morrison, G., et al. 2007, ApJ, 670, 156 [NASA ADS] [CrossRef] [Google Scholar]
- Elbaz, D., Daddi, E., Le Borgne, D., et al. 2007, A&A, 468, 33 [NASA ADS] [CrossRef] [EDP Sciences] [Google Scholar]
- Elvis, M., Civano, F., & Vignali, C. 2009, ApJS, 184, 158 [NASA ADS] [CrossRef] [Google Scholar]
- Foster, C., Hopkins, A. M., Gunawardhana, M., et al. 2012, A&A, 547, A79 [NASA ADS] [CrossRef] [EDP Sciences] [Google Scholar]
- Gilbank, D. G., Baldry, I. K., Balogh, M. L., et al. 2010, MNRAS, 405, 2594 [NASA ADS] [Google Scholar]
- Gilbank, D. G., Baldry, I. K., Balogh, M. L., et al. 2011, MNRAS, 412, 2111 [NASA ADS] [CrossRef] [Google Scholar]
- Hammer, F., Gruel, N., Thuan, T. X., et al. 2001, ApJ, 550, 570 [NASA ADS] [CrossRef] [Google Scholar]
- Holden, B. P., Oesch, P. A., Gonzalez, V. G., et al. 2014, ApJ, submitted [arXiv:1401:5490] [Google Scholar]
- Horne, K. 1986, PASP, 98, 609 [NASA ADS] [CrossRef] [EDP Sciences] [Google Scholar]
- Ilbert, O., Capak, P., Salvato, M., et al. 2009, ApJ, 690, 1236 [NASA ADS] [CrossRef] [Google Scholar]
- Jansen, R. A., Fabricant, D., Franx, M., et al. 2000, ApJS, 126, 331 [NASA ADS] [CrossRef] [MathSciNet] [Google Scholar]
- Kauffmann, G., Heckman, T. M., & Tremonti, C. 2003, MNRAS, 346, 1055 [Google Scholar]
- Kennicutt, R. C., Jr. 1998, ARA&A, 36, 189 [Google Scholar]
- Kewley, L. J., & Dopita, M. A. 2002, ApJSS, 142, 35 [NASA ADS] [CrossRef] [Google Scholar]
- Kewley, L. J., & Ellison, S. L. 2008, ApJ, 681, 1183 [NASA ADS] [CrossRef] [Google Scholar]
- Kewley, L. J., Heisler, C. A., Dopita, M. A., & Lumsden, S. 2001, ApJS, 132, 37 [NASA ADS] [CrossRef] [Google Scholar]
- Kewley, L. J., Dopita, M. A., Leitherer, C., et al. 2013a, ApJ, 774, 100 [NASA ADS] [CrossRef] [Google Scholar]
- Kewley, L.J., Maier, C., Yabe, K., et al. 2013b, ApJ, 774, 10 [Google Scholar]
- Kobulnicky, H. A., Wilmer, C. N. A., Weiner, B. J., et al. 2003, ApJ, 599, 1006 [NASA ADS] [CrossRef] [Google Scholar]
- Kuchner, U., Maier, C., Ziegler, B. L., et al. 2015, IAU Symp., 309, 289 [NASA ADS] [Google Scholar]
- Lamareille, F. 2010, A&A, 509, 53 [Google Scholar]
- Lamareille, F.,Brinchmann, J., Contini, T., et al. 2009, A&A, 495, 53 [NASA ADS] [CrossRef] [EDP Sciences] [Google Scholar]
- Lequeux, J., Peimbert, M., Rayo, J. F., et al. 1979, A&A, 80, 155 [NASA ADS] [Google Scholar]
- Lilly, S., Le Fevre, O., Crampton, D., et al. 1995, ApJ, 455, 50 [NASA ADS] [CrossRef] [Google Scholar]
- Lilly, S. J., Carollo, C. M., & Stockton, A. 2003, ApJ, 597, 730 [NASA ADS] [CrossRef] [Google Scholar]
- Lilly, S. J., Le Fevre, O., Renzini, A., et al. 2007, ApJS, 172, 70 [NASA ADS] [CrossRef] [Google Scholar]
- Lilly, S. J., Le Brun, V., Maier, C., et al. 2009, ApJS, 184, 218 [Google Scholar]
- Lilly, S. J., Carollo, C. M., Pipino, A., et al. 2013, ApJ, 772, 119 (Li13) [NASA ADS] [CrossRef] [Google Scholar]
- Liu, X., Shapley, A. E., Coil, A. L., et al. 2014, ApJ, 678, 758 [Google Scholar]
- Maier, C., Meisenheimer, K., & Hippelein, H. 2004, A&A, 418, 475 [NASA ADS] [CrossRef] [EDP Sciences] [Google Scholar]
- Maier, C., Lilly, S. J., Carollo, C. M., et al. 2005, ApJ, 634, 849, Ma05 [NASA ADS] [CrossRef] [Google Scholar]
- Maier, C., Lilly, S. J., Carollo, C. M., et al. 2006, ApJ, 639, 858 [NASA ADS] [CrossRef] [Google Scholar]
- Maier, C., Lilly, S. J., Zamorani, G., et al. 2009, ApJ, 694, 1099 [NASA ADS] [CrossRef] [Google Scholar]
- Maier, C., Lilly, S. J., Ziegler, B. L., et al. 2014, ApJ, 792, 3 [NASA ADS] [CrossRef] [Google Scholar]
- Maier, C., Lilly, S. J., Ziegler, B. L. et al. 2015, IAU Symp., 309, 281 [NASA ADS] [Google Scholar]
- Maiolino, R., Nagao, T., Grazian, A. et al. 2008, A&A, 488, 463 [NASA ADS] [CrossRef] [EDP Sciences] [Google Scholar]
- Mannucci, F., Cresci, G., Maiolino, R., et al. 2010, MNRAS, 408, 2115 (M10) [NASA ADS] [CrossRef] [Google Scholar]
- Moustakas, J., Kennicutt, Jr., R. C., & Tremonti, C. A. 2006, ApJ, 642, 775 [NASA ADS] [CrossRef] [Google Scholar]
- Moustakas, J., Coil, A. L., Aird, J., et al. 2013, ApJ, 767, 50 [NASA ADS] [CrossRef] [Google Scholar]
- Noeske, K. G., Weiner, B. J., Faber, S. M., et al. 2007, ApJ, 660, 43 [Google Scholar]
- Osterbrock, D. E. 1989, Astrophysics of Gaseous Nebulae and Active Galactic Nuclei (Mill Valley: University Science Books) [Google Scholar]
- Pagel, B. E. J., Edmunds, M. G., Blackwell, D. E., et al. 1979, MNRAS, 189, 95 [NASA ADS] [CrossRef] [Google Scholar]
- Peng, Y., Lilly, S. J., Kovac, K., et al. 2010, ApJ, 721, 123 [NASA ADS] [Google Scholar]
- Pérez-Montero, E., & Contini, T. 2009, MNRAS, 398, 949 [NASA ADS] [CrossRef] [Google Scholar]
- Pérez-Montero, E., Contini, T., Lamareille, F., et al. 2009, A&A, 495, 73 [NASA ADS] [CrossRef] [EDP Sciences] [Google Scholar]
- Pérez-Montero, E., Contini, T., Lamareille, F., et al. 2013, A&A, 549, A25 [NASA ADS] [CrossRef] [EDP Sciences] [Google Scholar]
- Pettini, M., & Pagel, B. E. J. 2004, MNRAS, 348, 59 [Google Scholar]
- Salim, S., Rich, R. M., Charlot, S. et al. 2007, ApJS, 173, 267 [NASA ADS] [CrossRef] [Google Scholar]
- Salpeter, E. E. 1955, ApJ, 121, 161 [Google Scholar]
- Scarlata, C., Carollo, C. M., Lilly, S. J., et al. 2007, ApJS, 172, 406 [NASA ADS] [CrossRef] [Google Scholar]
- Scoville, N., Aussel, H., Brusa, M., et al. 2007, ApJS, 172, 1 [NASA ADS] [CrossRef] [Google Scholar]
- Steidel, C. C., Rudie, G. C., Strom, A. L., et al. 2014, ApJ, 795, 165 [NASA ADS] [CrossRef] [Google Scholar]
- Tremonti, C. A., Heckman, T. M., Kauffmann, G., et al. 2004, ApJ, 613, 898 [NASA ADS] [CrossRef] [Google Scholar]
- Whitford, A. E. 1958, AJ, 63, 201 [NASA ADS] [CrossRef] [Google Scholar]
- Zahid, H. J., Kewley, L. J., & Bresolin, F. 2011, ApJ, 730, 137 [NASA ADS] [CrossRef] [Google Scholar]
Appendix A: More details on why breaking the R23 degeneracy using [OIII] λ 5007/Hβ works
The finding in Sect. 4.1 regarding breaking the R23 degeneracy using [ O III ] λ 5007/Hβ may be surprising because [ O III ] λ 5007/Hβ shows a similar behavior as a function of metallicity as the double-valued R23. However, some studies in the literature using the BPT (Baldwin et al. 1981) diagram, for example, Fig. 2 in Asari et al. (2007) and Fig. 1 in Kewley et al. (2013a), have shown that high [ O III ] λ 5007/Hβ correspond to low metallicities because of the curved shape of the star-forming sequence in the BPT diagram. We produced a BPT-like diagram, Fig. A.1, showing as a grid, color-coded as in the legend of Fig. 4, the expected O/H values using Eq. (4) in Kewley et al. (2013a), which corresponds to the Pettini & Pagel (2004) O3N2 calibration for the KD02 metallicity scale. Because emission-line galaxies lie along the star-forming sequence (with rough boundaries indicated by the dashed black lines), virtually all galaxies with [ O III ] λ 5007/Hβ> 1.8 values (above the magenta line) have O/H < 8.6 on the KD02 metallicity scale (cyan). This agrees with the empirical finding of Fig. 3 for zCOSMOS galaxies. We explore this issue further in the Clash paper mentioned in Sect. 4.1 (Maier et al., in prep.), where we also show that Clash emission line galaxies at intermediate redshifts lie on the star-forming sequence between the dashed black lines shown in Fig. A.1. Furthermore, Fig. A.1 also indicates why the O3N2 calibration works better at higher redshifts than the N2 calibration of Pettini & Pagel (2004), as claimed by Liu et al. (2008) and Steidel et al. (2014), for instance: if the star-forming sequence moves at higher redshift diagonally to higher [ O III ] λ 5007/Hβ and [ N II ] λ 6584/Hα values (as shown, e.g., in Kewley et al. 2013b), the O3N2 calibration still works (color of the grid points stays the same), while the N2 calibration gives too high values for the metallicity compared to local samples. We will discuss these findings in more detail in our paper mentioned above (Maier et al., in prep., first results shown in Kuchner et al. 2015).
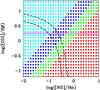 |
Fig. A.1 [ O III ] λ 5007/Hβ vs. [ N II ] λ 6584/Hα diagram with a grid color-coded like in the legend of Fig. 4 according to metallicity. Virtually all galaxies on the star-forming sequence (between the black dashed lines) and above the magenta line (i.e., with [ O III ] λ 5007/Hβ> 1.8) have O/H < 8.6 on the KD02 metallicity scale (cyan symbols). |
All Tables
Observed and derived quantities for the zCOSMOS 0.5 <z< 0.9 galaxies with NIR follow-up spectroscopy.
All Figures
|
Fig. 1 BPT (Baldwin et al. 1981) diagnostic diagram to separate star formation dominated galaxies from AGNs. The zCOSMOS galaxies with ISAAC spectroscopy are shown as filled red circles, z< 1 CFRS galaxies from Ma05 as filled green squares, and local NFGS galaxies from Jansen et al. (2000) as blue points. The zCOSMOS 0.5 <z< 0.9 galaxies lie below and to the left of the theoretical (solid) curve of Kewley et al. (2001) and of the empirical (dashed) curve of Kauffmann et al. (2003), which separate star-forming galaxies (below/left of the curves) from AGNs (above/right of the curves). |
| In the text | |
|
Fig. 2 Comparison of SFRs computed using different methods for zCOSMOS galaxies with ISAAC NIR spectroscopy. Panel a) shows a good agreement (within the measurements errors) of the SFRs from ISAAC Hα and SFRs from infrared COSMOS IRAC and MIPS data for the objects with infrared detections (Le Floch et al., in prep.). Panels b)−d) show the comparison of Hα-based SFRs with b) SFRs from the [OII] luminosity, applying the calibration reported by Gilbank et al. (2010), their Eq. (8), and taking into account the erratum of Gilbank et al. (2011) of that paper; c) SFRs derived from the [OII] luminosity using Eq. (2) of Maier et al. (2009), based on the study of Moustakas et al. (2006); and d) SFRs from the Hβ luminosity, assuming AV = 1 (an assumption often used in literature when the Balmer decrement cannot be measured) to derive Hα luminosities. The best agreement between the reliable extinction-corrected Hα -based SFRs and SFRs estimators based on other ELs (panels b)−d)) is depicted in panel b). |
| In the text | |
|
Fig. 3 D4000 vs. [ O III ] λ 5007/Hβ diagram used to break the R23 degeneracy for the 0.5 <z< 0.9 zCOSMOS galaxies (cyan points) without NIR spectroscopy. The 39 zCOSMOS galaxies with ISAAC spectroscopy are shown as blue filled circles for galaxies with low (branch) O/H measurements, red filled circles for galaxies with high (branch) O/H measurements, and green filled circles for the six galaxies with double-valued solutions (note that the D4000 and [ O III ] λ 5007/Hβ values of two galaxies are almost identical, i.e., the respective green circles coincide). This diagram can be used to break the lower/upper branch R23 degeneracy of other 0.5 <z< 0.9 galaxies without NIR spectroscopy, but similar D4000 and [OIII]/Hβ as the 33 benchmark galaxies with ISAAC spectroscopy and reliable metallicities. |
| In the text | |
|
Fig. 4 SSFR-mass relation for zCOSMOS galaxies at 0.5 <z< 0.62 (panels a) and c)) and at 0.62 <z< 0.75 (panels b) and d)), with the data points color-coded according to the measured metallicity value (legend in panel c)). The colors of the grid points in panel a) and b) indicate the metallicities expected for the Z(M, SFR) extrapolation of Li13. In panels a) and b), galaxies with ISAAC spectroscopy are shown as colored symbols, while ELOX galaxies with O/H < 8.6 (the respective cyan circles in panels c) and d)) are shown as black symbols as squares (triangles) for T2 (T3) morphologies. In panels c) and d) the large magenta filled circles show the mean values of the SSFRs in three mass bins. ELOX galaxies with lower R23 branch KD02 metallicities, O/H < 8.6, have typically lower masses (9.5 < log (M/M⊙) < 10.3), and preferentially irregular morphologies when they have higher SSFRs. This diagram also indicates that SFR is a second parameter in the MZR of the zCOSMOS sample at 0.5 <z< 0.75, because galaxies with higher (S)SFRs generally also have lower metallicities. |
| In the text | |
|
Fig. 5 MZR of zCOSMOS ELOX 0.5 <z< 0.75 galaxies (red circles) and galaxies with O/H measurements based on additional ISAAC spectroscopy (green filled circles), compared to the local MZR of Tremonti et al. (2004) and the MZR at 0.75 <z< 0.82 found by Zahid et al. (2011) using the DEEP2 sample. The individual DEEP2 data are shown as cyan symbols, while the mean DEEP2 MZR from Eq. (8) in Zahid et al. (2011), converted to the KD02 calibration, is shown as a blue line. The mean O/H values of zCOSMOS galaxies in three mass bins are shown as large magenta filled circles. While both zCOSMOS and DEEP2 galaxies at z ~ 0.5−0.8 have similar (slightly lower) metallicities at the higher masses compared to z ~ 0, a population of galaxies with metallicities lower by a factor 2−3 than SDSS exists at the lowest masses probed by zCOSMOS and DEEP2. |
| In the text | |
|
Fig. 6 SSFR-mass relation for the ELOX galaxies at 0.5 <z< 0.62 (panels a) and c)) and at 0.62 <z< 0.75 (panels b) and d)), with the lower panels showing only galaxies with T2 (disk) morphologies. Open circles depict the mean (color-coded as in Fig. 4) metallicity data of ELOX galaxies at the position of grid points with at least three ELOX galaxies within ± 0.05 dex in logSFR and logM from the SSFR and mass values of the respective grid point. It seems that the SFR is a second parameter in the MZR of the zCOSMOS sample at 0.5 <z< 0.75, because galaxies with higher (S)SFRs generally also have lower metallicities. |
| In the text | |
|
Fig. 7 Difference between the mean O/H at the position of grid points (color-coded as in Fig. 4) and the expected O/H from the formulations of Li13 (open circles) and M10 (filled circles). ELOX galaxies at 0.5 <z< 0.62 are shown in panels a) and c), and at 0.62 <z< 0.75 in panels b) and d), with the lower panels showing only galaxies with T2 (disk) morphologies. Because typical O/H uncertainties are 0.1−0.2 dex, the agreement between the measured and expected O/Hs is quite good, especially in panel c). |
| In the text | |
|
Fig. A.1 [ O III ] λ 5007/Hβ vs. [ N II ] λ 6584/Hα diagram with a grid color-coded like in the legend of Fig. 4 according to metallicity. Virtually all galaxies on the star-forming sequence (between the black dashed lines) and above the magenta line (i.e., with [ O III ] λ 5007/Hβ> 1.8) have O/H < 8.6 on the KD02 metallicity scale (cyan symbols). |
| In the text | |
Current usage metrics show cumulative count of Article Views (full-text article views including HTML views, PDF and ePub downloads, according to the available data) and Abstracts Views on Vision4Press platform.
Data correspond to usage on the plateform after 2015. The current usage metrics is available 48-96 hours after online publication and is updated daily on week days.
Initial download of the metrics may take a while.