Fig. 7
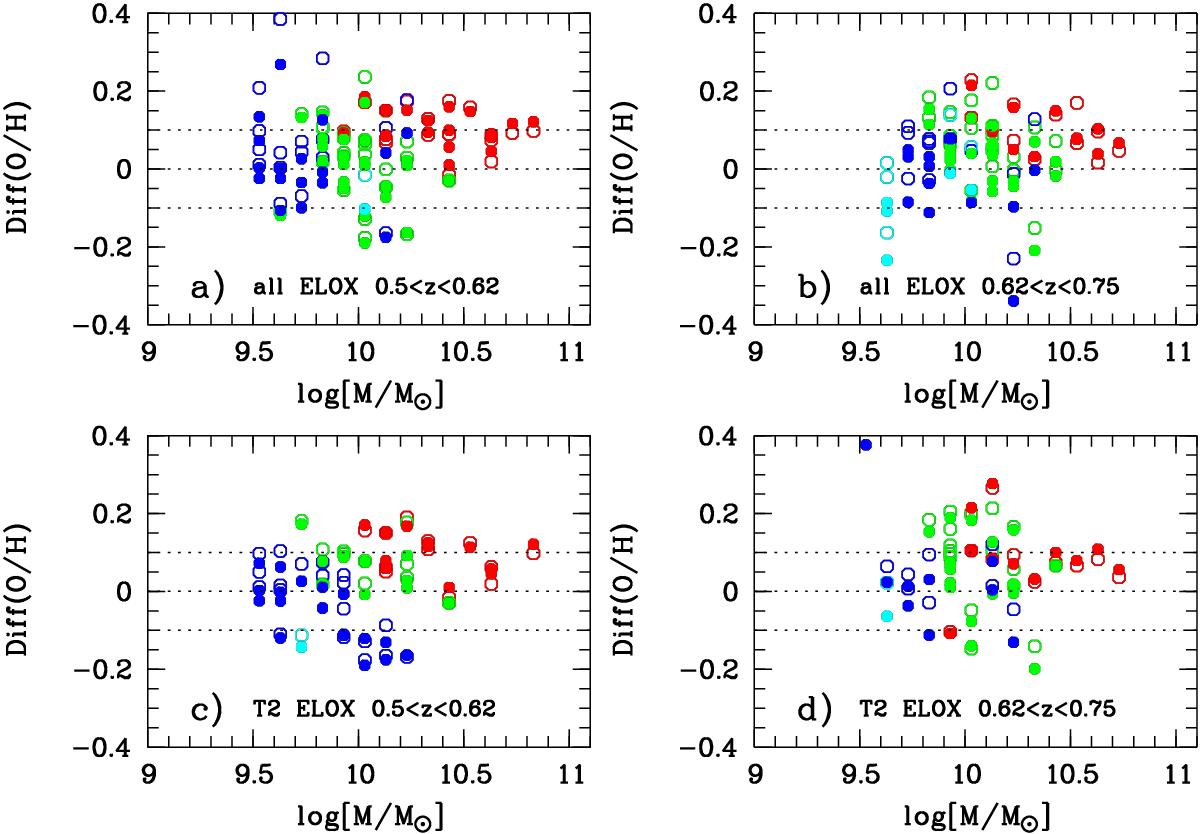
Difference between the mean O/H at the position of grid points (color-coded as in Fig. 4) and the expected O/H from the formulations of Li13 (open circles) and M10 (filled circles). ELOX galaxies at 0.5 <z< 0.62 are shown in panels a) and c), and at 0.62 <z< 0.75 in panels b) and d), with the lower panels showing only galaxies with T2 (disk) morphologies. Because typical O/H uncertainties are 0.1−0.2 dex, the agreement between the measured and expected O/Hs is quite good, especially in panel c).
Current usage metrics show cumulative count of Article Views (full-text article views including HTML views, PDF and ePub downloads, according to the available data) and Abstracts Views on Vision4Press platform.
Data correspond to usage on the plateform after 2015. The current usage metrics is available 48-96 hours after online publication and is updated daily on week days.
Initial download of the metrics may take a while.