Fig. 1
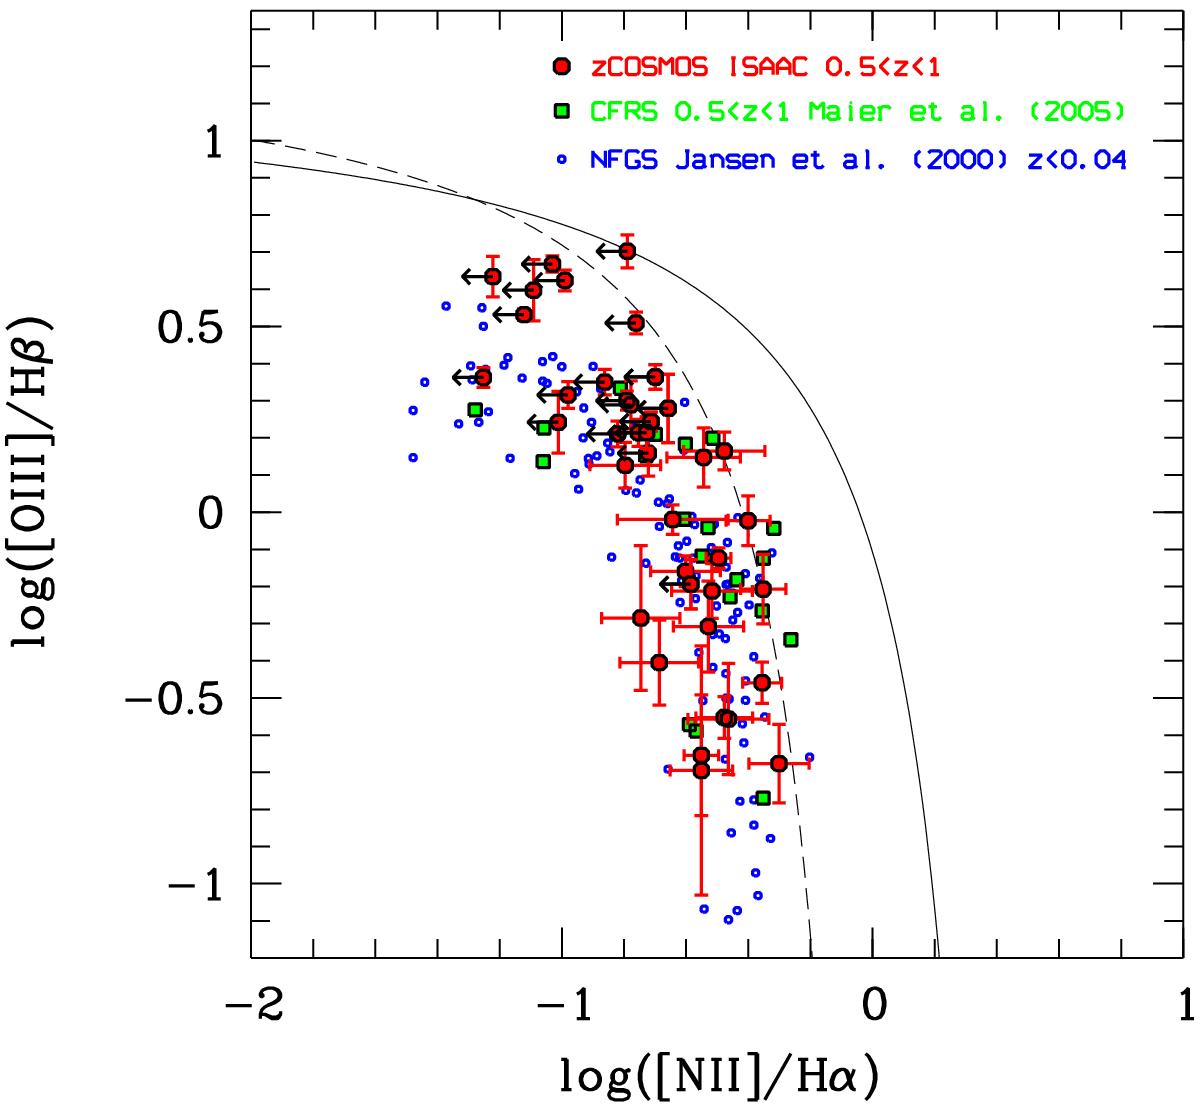
BPT (Baldwin et al. 1981) diagnostic diagram to separate star formation dominated galaxies from AGNs. The zCOSMOS galaxies with ISAAC spectroscopy are shown as filled red circles, z< 1 CFRS galaxies from Ma05 as filled green squares, and local NFGS galaxies from Jansen et al. (2000) as blue points. The zCOSMOS 0.5 <z< 0.9 galaxies lie below and to the left of the theoretical (solid) curve of Kewley et al. (2001) and of the empirical (dashed) curve of Kauffmann et al. (2003), which separate star-forming galaxies (below/left of the curves) from AGNs (above/right of the curves).
Current usage metrics show cumulative count of Article Views (full-text article views including HTML views, PDF and ePub downloads, according to the available data) and Abstracts Views on Vision4Press platform.
Data correspond to usage on the plateform after 2015. The current usage metrics is available 48-96 hours after online publication and is updated daily on week days.
Initial download of the metrics may take a while.