| Issue |
A&A
Volume 576, April 2015
|
|
|---|---|---|
| Article Number | L9 | |
| Number of page(s) | 4 | |
| Section | Letters | |
| DOI | https://doi.org/10.1051/0004-6361/201525718 | |
| Published online | 02 April 2015 | |
The influence of wavelength, flux, and lensing selection effects on the redshift distribution of dusty, star-forming galaxies
1 European Southern Observatory, Karl-Schwarzschild-Str. 2, 85748 Garching, Germany
e-mail: mbetherm@eso.org
2 Astronomy Centre, Department of Physics and Astronomy, University of Sussex, Brighton, BN1 9QH, UK
3 Laboratoire AIM-Paris-Saclay, CEA/DSM/Irfu – CNRS – Université Paris Diderot, CEA-Saclay, Pt courrier 131, 91191 Gif-sur-Yvette, France
Received: 22 January 2015
Accepted: 16 February 2015
We interpret the wide variety of redshift distributions for galaxies found by far-infrared and (sub) millimeter deep surveys depending on their depth and wavelength using our phenomenological model of galaxy evolution. This model reproduces the observed redshift distributions from 100 μm to 1.4 mm and, especially, the increase in the median redshift with survey wavelength without any new parameter tuning. This median redshift also varies significantly with the depth of the surveys, and deeper surveys do not necessarily probe higher redshifts. Paradoxically, at a fixed wavelength and flux limit, the lensed sources are not always at higher redshift. We found that the higher redshift of 1.4 mm-selected South Pole Telescope (SPT) sources compared to other SMG surveys is caused not only by the lensing selection, but also by the longer wavelength. This SPT sample is expected to be dominated by a population of lensed main-sequence galaxies and a minor contribution (~10%) of unlensed extreme starbursts.
Key words: submillimeter: galaxies / infrared: galaxies / galaxies: evolution / galaxies: high-redshift / galaxies: star formation / gravitational lensing: strong
© ESO, 2015
1. Introduction
Determining the star formation history in the Universe is a key challenge to understand the evolution of galaxies (Madau & Dickinson 2014). Two decades ago, the first deep submillimeter surveys (850 μm) revealed a population of dusty, strongly star-forming galaxies (e.g., Smail et al. 1997), which were missed by optical surveys. This showed the importance of submillimeter observations in drawing a complete picture of the star formation activity in the high-redshift Universe. Chapman et al. (2005) find that the median redshift of these submillimeter galaxies (SMGs) is 2.3. However, identifying the optical counterparts was not trivial because of the large beam of single-dish submillimeter telescopes (~15–20′′). Their precise position was determined by radio interferometry, and their redshift were measured using optical spectroscopy. This method was thus potentially biased against the highest redshift objects and galaxies in the 1.4 <z< 2 redshift desert.
A decade later, Vieira et al. (2010, 2013) identified a population of strongly-lensed dusty star-forming galaxies (DSFGs) in the 1.4 mm South Pole Telescope (SPT) survey. Using ALMA to derive spectroscopic redshifts directly by targeting CO-transitions at millimeter wavelengths, Weiß et al. (2013) found that their median redshift is 3.5. Simpson et al. (2014) used millimeter interferometry with a subarcsec resolution to directly confirm the optical counterparts of SMGs and measured a median photometric redshift similar to Chapman et al. (2005). Is this difference of median redshift caused by the different wavelengths or the lensing effect?
In this Letter, we discuss these selection effects using the Béthermin et al. (2012a, hereafter B12) model, which reproduces the redshift distribution of sources detected at all wavelengths from 100 μm to 2 mm (Sect. 2). Using a simplified version of this model, we explain why sources selected at longer wavelengths have a higher median redshift (Sect. 3). We then show how the redshift distribution of DSFGs is affected by the flux and lensing selection (Sect. 4). In Sect. 5, we discuss the SPT-selected population of galaxies in the light of our findings of the two preceding sections in more detail. We define LIR as the bolometric energy emitted by a galaxy between 8 and 1000 μm.
2. Model and comparison with observations
The B12 model is based on the observed evolution of the stellar mass (M⋆) function and the main-sequence of star-forming galaxies, i.e., a tight SFR-M⋆ correlation. At fixed mass, the star formation rate (SFR) increases rapidly but smoothly with redshift. This model also includes a population of starbursts with a strong excess of sSFR (=SFR/M⋆) that contributes 15% of the star formation density at z> 1 (Sargent et al. 2012). We used two different spectral energy distributions (SEDs) based on Magdis et al. (2012) for main-sequence and starburst galaxies. The dust of the main-sequence templates is warmer at higher redshifts. The contribution of strongly lensed galaxies is computed using the model of Hezaveh & Holder (2011). The source size can affect the lensing amplification (Hezaveh et al. 2012; Weiß et al. 2013). Recent observations (Ikarashi et al. 2014; Smolcic et al. 2015; Simpson et al. 2015) do not suggest any size evolution. We thus do not adopt any size evolution in our model. We focus on the 100–2000 μm range, since at shorter and larger wavelengths, the active galactic nuclei make a non-negligible contribution through their torus and/or synchrotron emissions (Drouart et al. 2014).
We test the validity of our model by comparing it with the large compilation of redshift distributions listed in Table 1. Overall, the model reproduces the observed redshift distributions well from 100 μm to 1.4 mm (see Fig. 1). At 2 mm (not shown in Fig. 1), only 5 of the of the 12 sources found by Staguhn et al. (2014) have known redshifts. Our model predicts a median redshift of 2.9 when assuming a flux cut of 0.24 mJy1, while they found 2.9 ± 0.4. The good agreement between our model and the data is not the result of fine tuning the ingredients of our model. We can nevertheless observe a small tension at 850 μm, where our distribution peaks at a redshift that is too high by Δz ~ 0.2. At the flux density cuts used for all panels in Fig. 1, our model predicts that we mainly select main-sequence galaxies. The smooth evolution of the main sequence (Schreiber et al. 2015) and the mass function (Ilbert et al. 2013), as well as the volume effects, is thus sufficient to explain the redshift distribution from 100 μm to 1.4 mm. Zavala et al. (2014) successfully extrapolate the redshift distributions from 850 μm up to 1.4 mm, but do not manage to reproduce the 450 μm. They claim that another galaxy population is necessary. This could be caused by their assumption of a flux-invariant redshift distribution, which is not present in our more refined model (see Sect. 4).
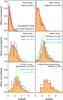 |
Fig. 1 Comparison between the prediction of our model (orange filled histogram) and the observations (see Table 1). The flux cuts indicated to compute the redshift distributions are indicated on the figures. The distributions are normalized to have ∫(dN/ dz) dz = 1 (expect the 100 μm normalized at 0.5 for clarity). |
3. Why does selection at longer wavelengths select higher redshift galaxies?
The shift of the peak of the redshift distribution toward higher redshift when wavelength increases (Fig. 1) can easily be explained using a simplified version of our model. In this version, we neglect the effect of the strong lensing and assume that all galaxies at a given redshift have the average main-sequence SED provided by the Magdis et al. (2012) template library. The lefthand panel of Fig. 2 shows how the LIR limit at which sources can be detected evolves with redshift for the flux density cuts used in Fig. 1. At z> 1, the curve is almost flat at 1.4 mm, but increases quickly with increasing redshift at 250 μm. This is caused by the shift in the peak of the dust emission (~100 μm restframe) toward the observed millimeter wavelengths when the redshift increases (e.g., Blain et al. 2002).
The redshift distribution can then be deduced from the luminosity function (LF). The righthand panel of Fig. 2 shows the cumulative luminosity functions at z = 1 and z = 4 computed from the B12 model. These functions are renormalized to directly provide the number of sources per square degree and redshift interval above a certain LIR cut. The x-axis and y-axis were switched with respect to the usual representation to illustrate the connection better with the lefthand panel. At 250 μm, the LIR limit of surveys is 24 times larger at z = 4 than at z = 1. Consequently, despite a slightly higher density of luminous objects at z = 4, we detect 450 times fewer objects at z = 4, because of the steep slope of the luminosity function above the knee. At 1.4 mm, the LIR limits are similar at both redshifts, but we detect five times more objects at z = 4, because of the evolution of the LF.
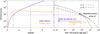 |
Fig. 2 Simplified diagram illustrating the impact of the wavelength on the redshift distribution. Left panel: detection limit in bolometric infrared luminosity (LIR) as a function of redshift for a S250> 20 mJy (purple) and S1400> 1 mJy (gold). These limit are computed using the Magdis et al. (2012) main-sequence SED library. We neglected the scatter and the starburst populations to simplify this diagram. Right panel: number density of objects per redshift interval (computed from the luminosity function and the geometry of the Universe) as a function of the LIR cut (x and y axis are inverted) at z = 1 (dashed line) and z = 4 (dot-dash line). These curves are computed using our model. The colored arrows represent the ratio between the number density of z = 1 and z = 4 sources. The black arrow highlights the increase in the luminosity and the decrease in the density of the knee of the LF between z = 1 and z = 4. |
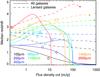 |
Fig. 3 Median redshift of dusty galaxies as a function of the flux cut at various wavelengths (see color coding in the plot). The solid lines correspond to full samples and dashed lines to strongly-lensed samples. The filled dot indicates the limit of one source per 2π sr (about half of the sky is sufficiently clean for extragalactic surveys). The observations listed in Table 1 are symbolized by diamonds (full samples) and a square (SPT lensed sample). |
4. Impact of flux and lensing on the redshift distribution
We also used the standard version of our model (including strong lensing, different templates for main-sequence and starburst galaxies, and temperature dispersion) to predict more precisely how the median redshift of galaxies selected by photometric surveys changes depending on the wavelength and the flux density cut (Fig. 3).
At λ ≥ 450 μm, we found an abrupt decrease in the median redshift around 100 mJy (10 mJy at 2 mm). This sharp transition is caused by the presence of two bumps in the redshift distributions: local galaxies around the knee of the luminosity function and luminous galaxies z ~ 2–3. There are fewer sources at z ~ 0.5–1 than at z ~ 0.1, because the LIR limit is well above the knee of the luminosity function. There are also more sources at z ~ 2–3 than at z ~ 0.5–1, because the volume probed is larger and the number of luminous galaxies per unit of volume higher (see, e.g., Béthermin et al. 2011). At high fluxes, the number of nearby objects decreases following an Euclidian trend in S− 5/2 (see, e.g. Planck Collaboration Int. VII 2013). At higher redshift, we are probing objects above the knee of the luminosity function, where the slope is exponential. Consequently, when we observe at very high flux, the nearby population always dominates the redshift distribution.
The redshift distribution of strongly-lensed galaxies (Fig. 3) is not similar to the full sample. Up to 1.1 mm, the lensed galaxies are always at higher redshifts than the full sample. This is expected, since the probability of lensing increases with redshift because of the higher probability of finding a massive galaxy on the line of sight (see, e.g., Hezaveh & Holder 2011). However, at a longer wavelength, the lensed objects can have a lower median redshift in some specific flux range (2–7 mJy at 1.4 mm). The lensed population have sub-mJy intrinsic fluxes. These sources tend to be at a lower median redshift than the intrinsically brighter unlensed sources, because they are drawn around or below the knee of the luminosity function at all redshift. The detection of these intermediate-redshift sources is thus less penalized than at higher fluxes. This effect compensates for the lensing effect, which biases the redshift distributions toward higher redshift.
These results suggest that the best strategy for building samples of high-redshift galaxies is to perform the survey at the longest possible wavelength. However, all objects below z = 8 have similar 1.4 mm/2 mm colors, because they are all observed in the Rayleigh-Jeans regime. The flux at 2 mm is three times lower, while the sensitivity of instruments is similar for the two wavelengths. Consequently, the number expected of detections for the same integration time is significantly lower. The higher median redshift at 2 mm is mainly caused by the lack of LIR sensitivity at z< 2 rather than by a better efficiency at detecting very high redshift sources. A compromise thus must be found between the long wavelength and the efficiency of the survey, defined here as the number of detections per hour. Furthermore, the risk of contamination by free-free emission increases, and source identification at longer wavelengths is more difficult because of the larger beam. At λ> 500 μm, the median redshift decreases when we go deeper than 1 mJy. Deeper surveys do not automatically imply higher redshifts.
5. A closer look at the SPT galaxy population
The SPT survey found a large population of lensed galaxies using a selection at 1.4 mm (Vieira et al. 2010). Weiß et al. (2013) find that their median redshift is the highest measured to date in a simple photometric selection. We discuss their characteristics in this section. Figure 4 shows the redshift distribution predicted by the B12 model of sources selected at 1.4 mm with the 20 mJy density flux cut of Weiß et al. (2013), but also a lower (1 mJy) and a higher (100 mJy) one to illustrate how this influences the nature of the selected sources. The contribution of z< 0.1 is significant for 20 mJy and 100 mJy (32% and 70%, respectively), but negligible for 2 mJy (0.9%). Since we are more interested in the high-z population, we normalized the redshift distribution in Fig. 4 ignoring the objects at z< 0.1.
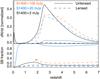 |
Fig. 4 Upper panel: redshift distribution from the B12 model of dusty galaxies selected at 1.4 mm for various flux cuts (see color coding in the plot). The unlensed galaxies are represented by solid lines and the contribution of lensed populations by a dashed line. For each flux cut, we normalized the sum of the lensed and unlensed distributions considering only z> 0.1 sources to allow an easier comparison of high redshift distributions. Lower panel: fraction of starbursts. The curves are not plotted, where dN/dz< 1 sr-1. |
The nature of the high-redshift sources also depends strongly on the flux cut. For the 20 mJy cut, 87% of sources are lensed, and 90% of them are classified by the model as “main-sequence”. Using a mock catalog based on our model, we estimated that their average sSFR is 1.7 times higher than the center of the main sequence, while in our model, we define starbursts as lying more than four times above. Because of their higher SFR at fixed stellar mass, the galaxies slightly above (~1σ) the center of the main sequence are easier to detect than objects slightly below. The unlensed sources are extreme HyLIRG (hyper luminous infrared galaxies, LIR> 1013L⊙) starbursts with an excess compared to the main sequence greater than a factor of 4. For 100 mJy, all the high-redshift sources are lensed. This is expected because the minimal intrinsic luminosity needed to detect a source without lensing, assuming our coldest template, is 1014L⊙, which is unphysical. For a cut of 2 mJy corresponding to the expected sensitivity of SPT-3g (Benson et al. 2014), we typically expect to detect unlensed ULIRGs (ultra luminous infrared galaxies, ⟨ LIR ⟩ = 7 × 10¹²L⊙) at z ~ 3.2. At this redshift, this corresponds to the knee of the luminosity function. The slope of the counts is thus shallower, and the contribution of lensed sources is small (2.9%).
Our model predicts that SPT sources lie only slightly above and still well within the scatter of the main sequence. The high
SFR of these objects is expected to be caused by large gas reservoirs rather than a merger-induced, boosted star-formation efficiency (Sargent et al. 2014; Béthermin et al. 2015).
6. Conclusion
The B12 model allows us to understand how the observed redshift distributions of DSFGs depend on how they are selected. Our main findings follow:
-
The B12 model successfully reproduces the redshiftdistributions from 100 μm to 1.4 mm without any additional parameter tuning.
-
When we select sources at longer wavelengths, the median redshift of the sources increases. This effect can be easily explained by considering the LIR limit versus redshift of the surveys and the evolution of the infrared LF.
-
The median redshift of the DSFGs also varies with survey depth. The deeper surveys in the (sub-)millimeter surprisingly probe lower redshifts. At λ> 1.4 mm in specific flux intervals, the lensed objects can also be at higher redshifts than unlensed sources.
-
The DSFGs selected by SPT are mainly strongly magnified, main-sequence galaxies, but 10% of these sources are predicted to be unlensed HyLlRGs.
Acknowledgments
We acknowledge the grants ERC-StG UPGAL 240039 and ANR-08-JCJC-0008 and Manuel Aravena for his useful comments.
References
- Benson, B. A., Ade, P. A. R., Ahmed, Z., et al. 2014, SPIE Conf. Ser., 9153, 1 [Google Scholar]
- Berta, S., Magnelli, B., Nordon, R., et al. 2011, A&A, 532, A49 [NASA ADS] [CrossRef] [EDP Sciences] [Google Scholar]
- Béthermin, M., Dole, H., Lagache, G., Le Borgne, D., & Penin, A. 2011, A&A, 529, A4 [NASA ADS] [CrossRef] [EDP Sciences] [Google Scholar]
- Béthermin, M., Daddi, E., Magdis, G., et al. 2012a, ApJ, 757, L23 [NASA ADS] [CrossRef] [Google Scholar]
- Béthermin, M., Le Floc’h, E., Ilbert, O., et al. 2012b, A&A, 542, A58 [NASA ADS] [CrossRef] [EDP Sciences] [Google Scholar]
- Béthermin, M., Daddi, E., Magdis, G., et al. 2015, A&A, 573, A113 [NASA ADS] [CrossRef] [EDP Sciences] [Google Scholar]
- Blain, A. W., Smail, I., Ivison, R. J., Kneib, J.-P., & Frayer, D. T. 2002, Phys. Rep., 369, 111 [NASA ADS] [CrossRef] [Google Scholar]
- Casey, C. M., Chen, C.-C., Cowie, L. L., et al. 2013, MNRAS, 436, 1919 [NASA ADS] [CrossRef] [Google Scholar]
- Chapman, S. C., Blain, A. W., Smail, I., & Ivison, R. J. 2005, ApJ, 622, 772 [NASA ADS] [CrossRef] [Google Scholar]
- Drouart, G., De Breuck, C., Vernet, J., et al. 2014, A&A, 566, A53 [NASA ADS] [CrossRef] [EDP Sciences] [Google Scholar]
- Geach, J. E., Chapin, E. L., Coppin, K. E. K., et al. 2013, MNRAS, 432, 53 [NASA ADS] [CrossRef] [Google Scholar]
- Hezaveh, Y. D., & Holder, G. P. 2011, ApJ, 734, 52 [NASA ADS] [CrossRef] [Google Scholar]
- Hezaveh, Y. D., Marrone, D. P., & Holder, G. P. 2012, ApJ, 761, 20 [NASA ADS] [CrossRef] [Google Scholar]
- Ikarashi, S., Ivison, R. J., Caputi, K. I., et al. 2014, ApJ, submitted [arXiv:1411.5038] [Google Scholar]
- Ilbert, O., McCracken, H. J., Le Fèvre, O., et al. 2013, A&A, 556, A55 [NASA ADS] [CrossRef] [EDP Sciences] [Google Scholar]
- Madau, P., & Dickinson, M. 2014, ARA&A, 52, 415 [NASA ADS] [CrossRef] [Google Scholar]
- Magdis, G. E., Daddi, E., Béthermin, M., et al. 2012, ApJ, 760, 6 [NASA ADS] [CrossRef] [Google Scholar]
- Michałowski, M. J., Dunlop, J. S., Cirasuolo, M., et al. 2012, A&A, 541, A85 [NASA ADS] [CrossRef] [EDP Sciences] [Google Scholar]
- Planck Collaboration Int. VII. 2013, A&A, 550, A133 [NASA ADS] [CrossRef] [EDP Sciences] [Google Scholar]
- Sargent, M. T., Béthermin, M., Daddi, E., & Elbaz, D. 2012, ApJ, 747, L31 [NASA ADS] [CrossRef] [Google Scholar]
- Sargent, M. T., Daddi, E., Béthermin, M., et al. 2014, ApJ, 793, 19 [NASA ADS] [CrossRef] [Google Scholar]
- Schreiber, C., Pannella, M., Elbaz, D., et al. 2015, A&A, 575, A74 [NASA ADS] [CrossRef] [EDP Sciences] [Google Scholar]
- Simpson, J. M., Swinbank, A. M., Smail, I., et al. 2014, ApJ, 788, 125 [Google Scholar]
- Simpson, J. M., Smail, I., Swinbank, A. M., et al. 2015, ApJ, 799, 81 [CrossRef] [Google Scholar]
- Smail, I., Ivison, R. J., & Blain, A. W. 1997, ApJ, 490, L5 [NASA ADS] [CrossRef] [Google Scholar]
- Smolcic, V., Aravena, M., Navarrete, F., et al. 2012, A&A, 548, A4 [NASA ADS] [CrossRef] [EDP Sciences] [Google Scholar]
- Smolcic, V., Karim, A., Miettinen, O., et al. 2015, A&A, in press, DOI: 10.1051/0004-6361/201424996 [Google Scholar]
- Staguhn, J. G., Kovács, A., Arendt, R. G., et al. 2014, ApJ, 790, 77 [NASA ADS] [CrossRef] [Google Scholar]
- Vieira, J. D., Crawford, T. M., Switzer, E. R., et al. 2010, ApJ, 719, 763 [NASA ADS] [CrossRef] [Google Scholar]
- Vieira, J. D., Marrone, D. P., Chapman, S. C., et al. 2013, Nature, 495, 344 [NASA ADS] [CrossRef] [Google Scholar]
- Wardlow, J. L., Smail, I., Coppin, K. E. K., et al. 2011, MNRAS, 415, 1479 [NASA ADS] [CrossRef] [Google Scholar]
- Weiß, A., De Breuck, C., Marrone, D. P., et al. 2013, ApJ, 767, 88 [NASA ADS] [CrossRef] [Google Scholar]
- Yun, M. S., Scott, K. S., Guo, Y., et al. 2012, MNRAS, 420, 957 [NASA ADS] [CrossRef] [Google Scholar]
- Zavala, J. A., Aretxaga, I., & Hughes, D. H. 2014, MNRAS, 443, 2384 [NASA ADS] [CrossRef] [PubMed] [Google Scholar]
All Tables
All Figures
|
Fig. 1 Comparison between the prediction of our model (orange filled histogram) and the observations (see Table 1). The flux cuts indicated to compute the redshift distributions are indicated on the figures. The distributions are normalized to have ∫(dN/ dz) dz = 1 (expect the 100 μm normalized at 0.5 for clarity). |
| In the text | |
|
Fig. 2 Simplified diagram illustrating the impact of the wavelength on the redshift distribution. Left panel: detection limit in bolometric infrared luminosity (LIR) as a function of redshift for a S250> 20 mJy (purple) and S1400> 1 mJy (gold). These limit are computed using the Magdis et al. (2012) main-sequence SED library. We neglected the scatter and the starburst populations to simplify this diagram. Right panel: number density of objects per redshift interval (computed from the luminosity function and the geometry of the Universe) as a function of the LIR cut (x and y axis are inverted) at z = 1 (dashed line) and z = 4 (dot-dash line). These curves are computed using our model. The colored arrows represent the ratio between the number density of z = 1 and z = 4 sources. The black arrow highlights the increase in the luminosity and the decrease in the density of the knee of the LF between z = 1 and z = 4. |
| In the text | |
|
Fig. 3 Median redshift of dusty galaxies as a function of the flux cut at various wavelengths (see color coding in the plot). The solid lines correspond to full samples and dashed lines to strongly-lensed samples. The filled dot indicates the limit of one source per 2π sr (about half of the sky is sufficiently clean for extragalactic surveys). The observations listed in Table 1 are symbolized by diamonds (full samples) and a square (SPT lensed sample). |
| In the text | |
|
Fig. 4 Upper panel: redshift distribution from the B12 model of dusty galaxies selected at 1.4 mm for various flux cuts (see color coding in the plot). The unlensed galaxies are represented by solid lines and the contribution of lensed populations by a dashed line. For each flux cut, we normalized the sum of the lensed and unlensed distributions considering only z> 0.1 sources to allow an easier comparison of high redshift distributions. Lower panel: fraction of starbursts. The curves are not plotted, where dN/dz< 1 sr-1. |
| In the text | |
Current usage metrics show cumulative count of Article Views (full-text article views including HTML views, PDF and ePub downloads, according to the available data) and Abstracts Views on Vision4Press platform.
Data correspond to usage on the plateform after 2015. The current usage metrics is available 48-96 hours after online publication and is updated daily on week days.
Initial download of the metrics may take a while.