Fig. 4
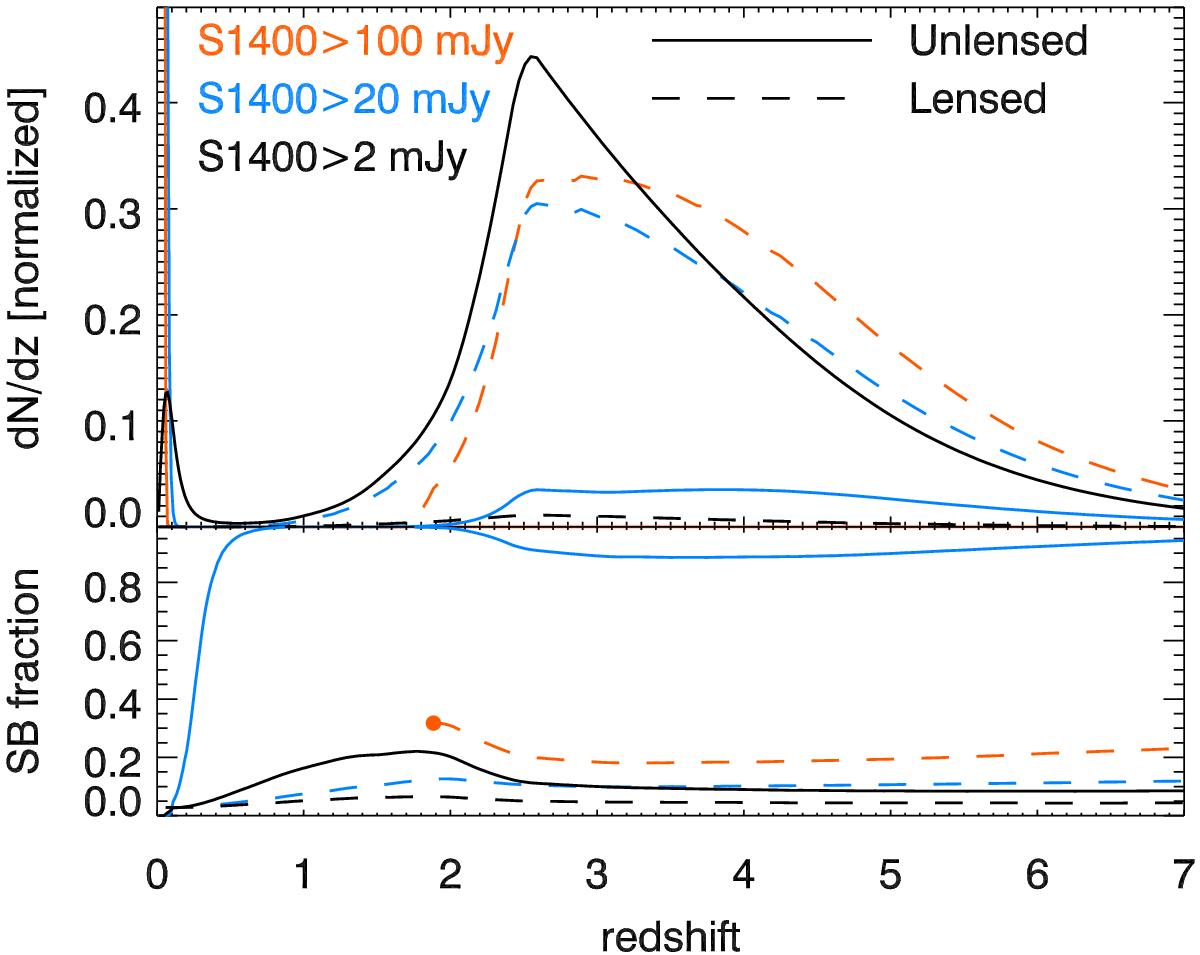
Upper panel: redshift distribution from the B12 model of dusty galaxies selected at 1.4 mm for various flux cuts (see color coding in the plot). The unlensed galaxies are represented by solid lines and the contribution of lensed populations by a dashed line. For each flux cut, we normalized the sum of the lensed and unlensed distributions considering only z> 0.1 sources to allow an easier comparison of high redshift distributions. Lower panel: fraction of starbursts. The curves are not plotted, where dN/dz< 1 sr-1.
Current usage metrics show cumulative count of Article Views (full-text article views including HTML views, PDF and ePub downloads, according to the available data) and Abstracts Views on Vision4Press platform.
Data correspond to usage on the plateform after 2015. The current usage metrics is available 48-96 hours after online publication and is updated daily on week days.
Initial download of the metrics may take a while.